
FIGURE 10.
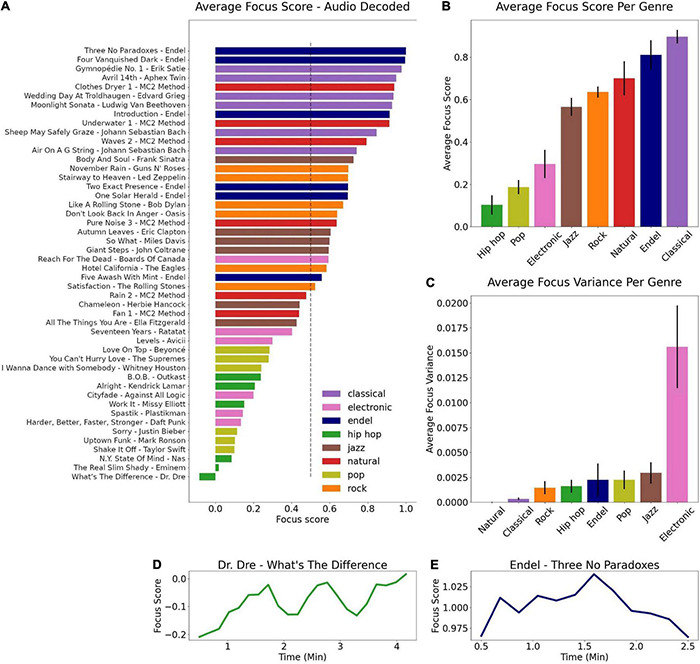
Projecting new songs into the trained audio model. (A) Sorted focus scores per song obtained by the audio model, colored by genre. (B) Average focus score per genre, sorted from the genre with the lowest score (hip-hop) to the highest (classical). (C) Average focus variance per genre, sorted from the genre with the lowest variance (natural) to highest (electronic). Focus dynamics for the song with the lowest focus score (D) and the highest (E).