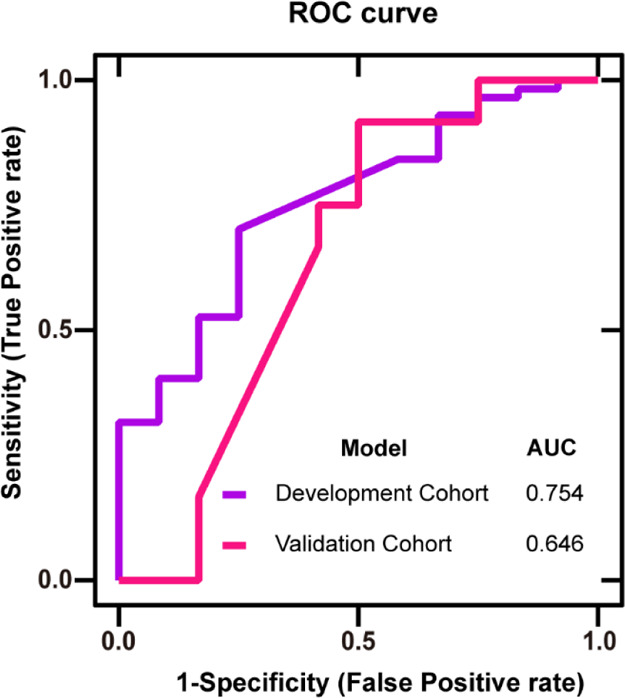
Figure 4.

ROC curve of the development cohort and validation cohort based on significant features: X-axis: false positive rate, Y-axis: true positive rate, purple line: development cohort, and pink line: validation cohort. The AUCs were 0.754 and 0.646, respectively.
