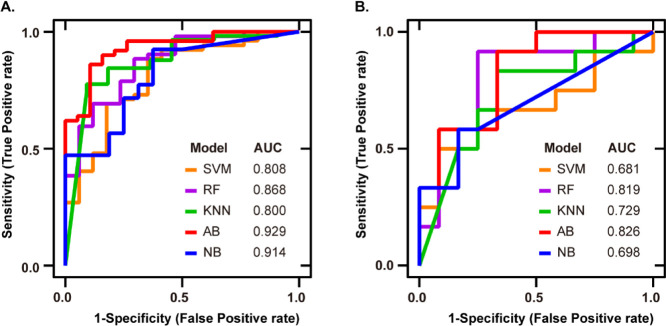
Figure 5.
ROC curve analysis to evaluate the performance of different classifier construction models. Each colored line represents the ROC curve of the Parkinson’s odor diagnosis model constructed by different classifiers: (A) development cohort: the ROC curve of the model. The AUCs of five classifiers (SVM, RF, KNN, AB, and NB) are 0.808, 0.868, 0.800, 0.929, and 0.914, respectively and (B) validation cohort: the ROC curve of the medical diagnostic tests. The AUCs of five classifiers are 0.681, 0.819, 0.729, 0.826, and 0.698, respectively.

