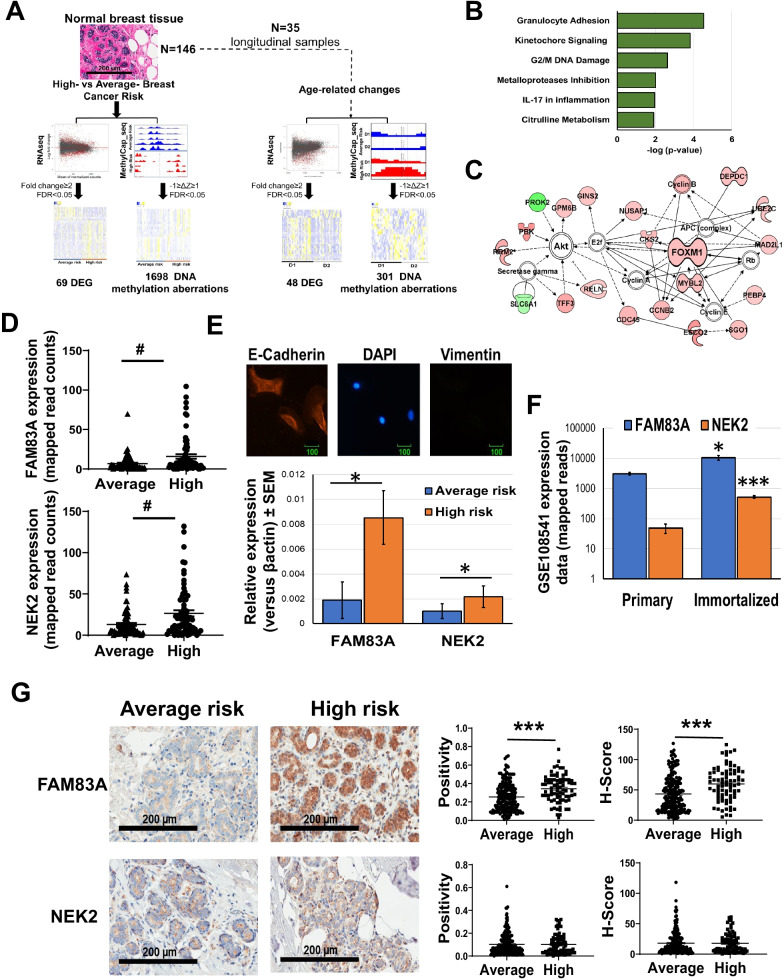
Fig. 1.
Transcriptome profiling of breast tissues from women at either high- or average risk of breast cancer. A Schematics of the study design. Cancer-free breast tissue cores (N = 146) were divided in either high-risk or average-risk group according to the Tyrer-Cuzick breast cancer risk evaluation score (20% used as threashold). The tissues were processed and analyzed for whole transcriptome and methylome profiling and differentially expressed genes (DEG) and differentially methylated sites between high- and average-risk samples were identified. Thirty five women (10 high risk and 25 average risk) donated also a second biopsy (D2) allowing to detect age-dependent aberrations. B Pathway analysis of the transcripts differentially expressed (FDR < 0.05) between average and high- risk breasts. C Major molecular network of the differentially expressed transcripts between the two experimental groups. Genes upregulated in high-risk breasts are in red, while downregulated genes are in green. D FAM83A and NEK2 transcription level in breast tissues from women at either average- or high-risk of developing breast cancer. E Upper panel: Representative image of the immunofluorescence staining of primary breast epithelial cells with the epithelial marker, E-Cadherin (red), mesenchymal marker, Vimentin (green) as control, and nuclear staining, DAPI (blue). E-Cadherin and Vimentin staining of primary cells revealed that isolated primary cells are epithelial in nature. Lower panel: FAM83A and NEK2 expression in primary epithelial cells isolated from either average-risk (n = 4) and high-risk breast (n = 3). F FAM83A and NEK2 expression in primary and h-TERT immortalized isogenic breast epithelial cells (n = 7) from the GSE108541 dataset. G) Representative images of immunohistochemical staining for FAM83A and NEK2 are shown at 20X magnification. Staining quantification is expressed as positivity and H-score. Data are shown as mean ± standard error. #FDR < 0.005, *p < 0.05,**p < 0.001, ***p < 0.0001. Pvalue is calculated using either unpaired nonparametric Mann–Whitney test or nonparametric Wilcoxon test

