Fig. 1.
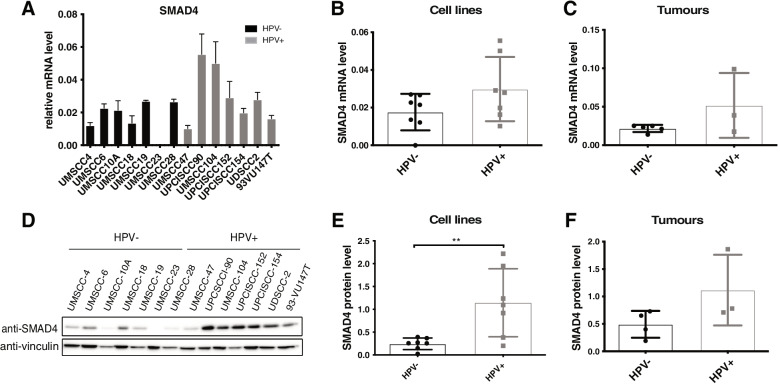
Analysis of SMAD4 expression in HPV-positive HNC cell lines and tumours. A Total RNAs from HNC cell lines were isolated for RT-qPCR. SMAD4 expression was normalized to RpP0 and shown as means ± SD of at least three independent experiments. B Box plot showing means ± SD and individual values of results shown in (A). C Total RNAs from frozen tissue samples of 5 HPV-negative and 3 HPV-positive HNC patients were isolated for RT-qPCR. SMAD4 expression was normalized to RpP0 and shown as Box plot of the means ± SD and individual values. D HNC cell lines were lysed and analysed by immunoblotting with the indicated antibodies. E Box plot showing means ± SD and individual values of Optical density analysis of the expression of SMAD4 normalised to loading control (vinculin) from at least three independent western blot experiments in HNC cell lines. **, P < 0.01 (unpaired t test). F Box plot showing means ± SD and individual values of Optical density analysis from immunoblotting of SMAD4 expression from frozen tissue samples of 4 HPV-negative and 3 HPV-positive HNC patients

