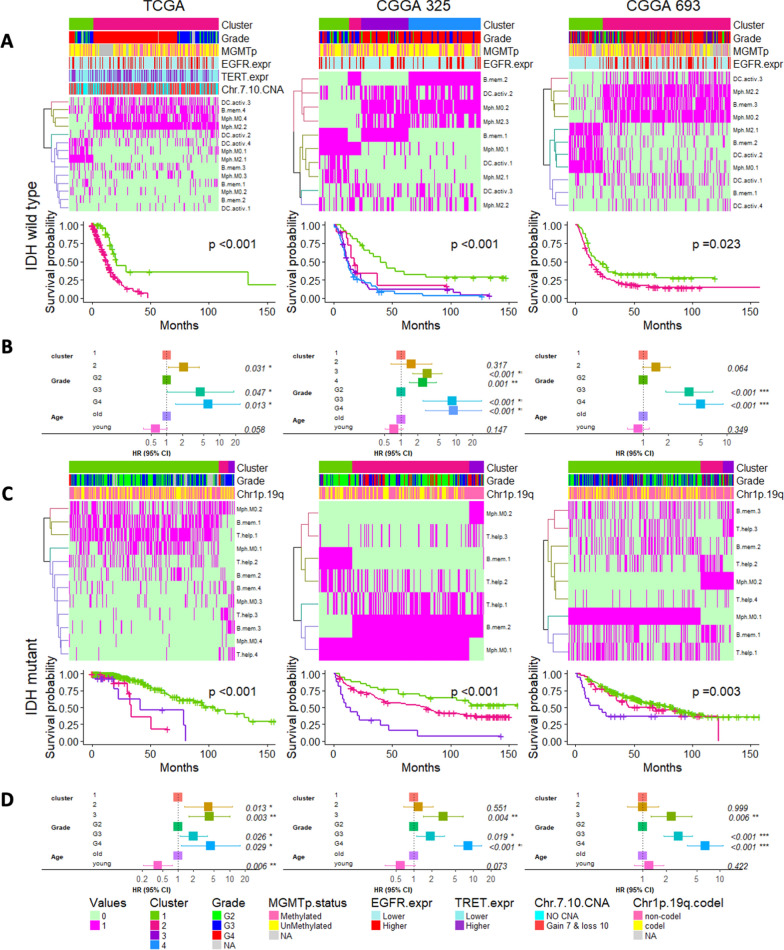
Fig. 4.
Tumor groups with distinct immune signatures based on selected cell types. A Heatmaps representing hierarchical clustering of the clusters identified from selected immune cell types from IDH-WT tumors. The above annotation bars representing the distributions of cluster assignments, tumor grade, MGMT promoter methylation, EGFR expression, TERT expression (surrogating the status of TERT promoter mutation) and Chr7 gain & Chr10 loss followed by their Kaplan–Meier curves denoting their survival differences and B forest plots displaying prognostic association of these immune based clusters for IDH-WT. Similarly, C heatmaps representing the hierarchical clustering of the clusters identified from selected immune cell types from IDH-MUT tumors. The above annotation bars representing the distributions of cluster assignments, tumor grade and Chr1p/19q loss with Kaplan–Meier curves below the heatmap denoting their survival differences and D forest plots displaying prognostic association of these immune based clusters for IDH-MUT tumors

