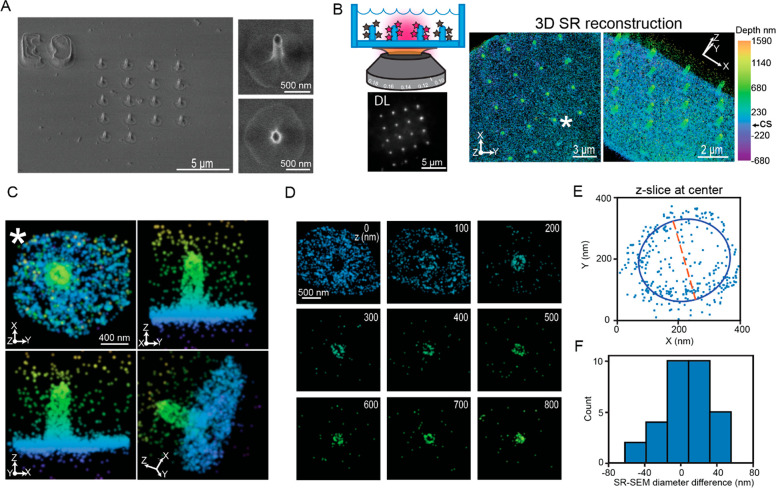
Figure 3.
Comparison between 3D SR reconstructions of surface-labeled nanopillars and SEM images. (A) SEM images of a patterned array of nanopillars. The reference marker (E9) is clearly visible in the top left image of the nanopillars with a 30° tilt. The magnified images to the right of the image show an individual nanopillar; top with the tilt and bottom a top-down view. The dimple at the coverslip and elliptical shape of the pillars are clearly visible. (B) Top left is a cartoon depiction demonstrating imaging surface-labeled nanopillars. Below, the bright puncta in an array of surface-labeled nanopillars is visible in the DL image. Right: Two orientations of the 3D SR reconstructions show an array of nanopillars. Color encodes Z-position. CS in calibration bar refers to the position of the coverslip. (C) Magnified images of an individual pillar (∗ in B) at various orientations. (D) 100 nm Z-slices of the pillar (C) from the bottom of the coverslip to the top of the nanopillar. Clear elliptical-shaped rings are visible. (E) 250 nm Z-slices of the 3D data shown as an XY projection at the center of an individual nanopillar fit to an ellipse. The orange dashed line is one axis extracted from the fit and may be compared to diameters extracted from SEM images. (F) Histogram depicts the difference in diameter between the 3D SR reconstructions and the SEM images of the nanopillars.

