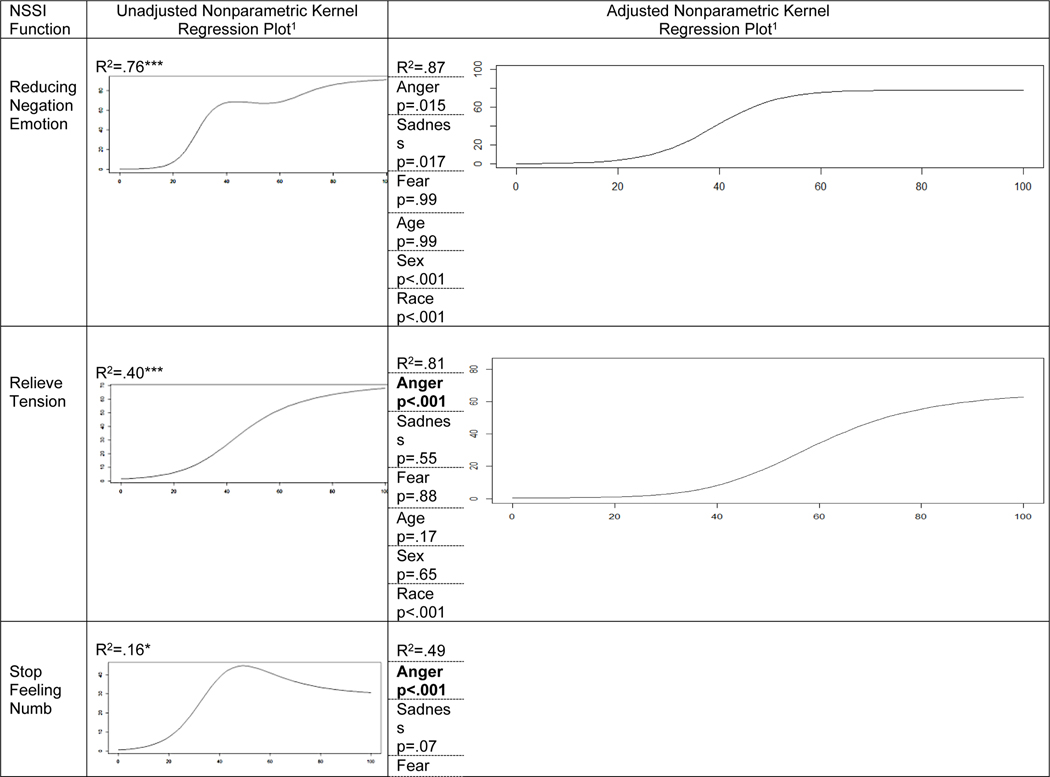
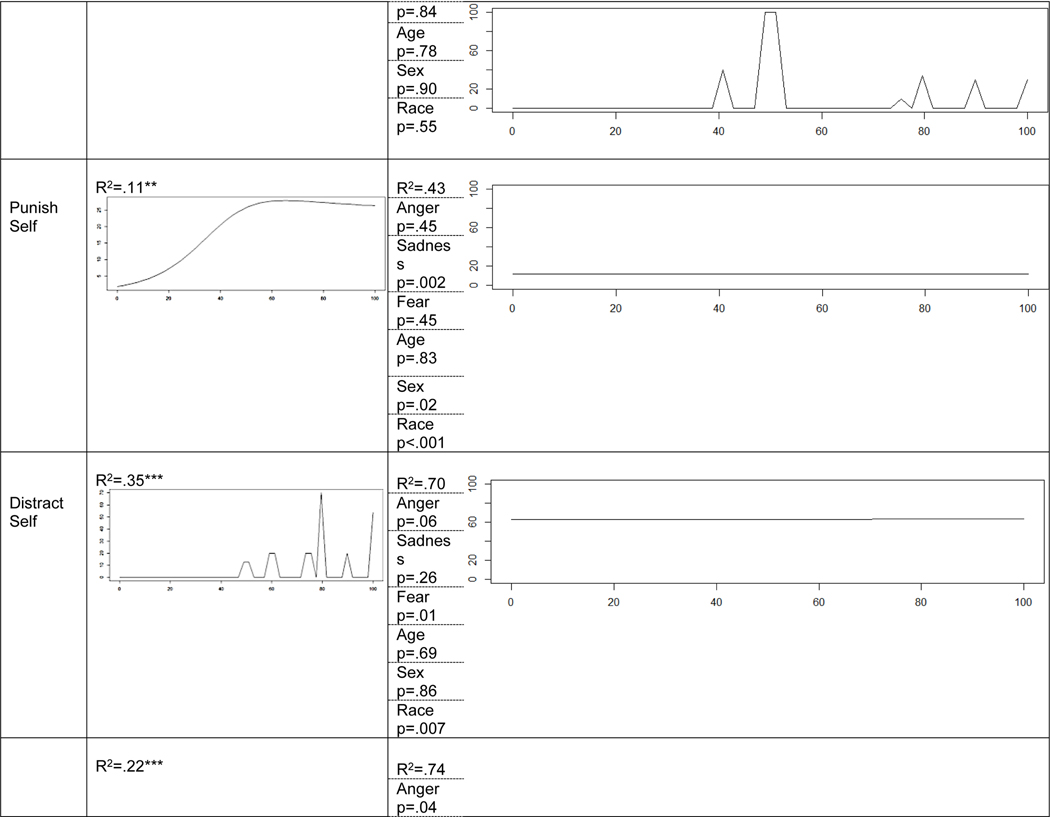
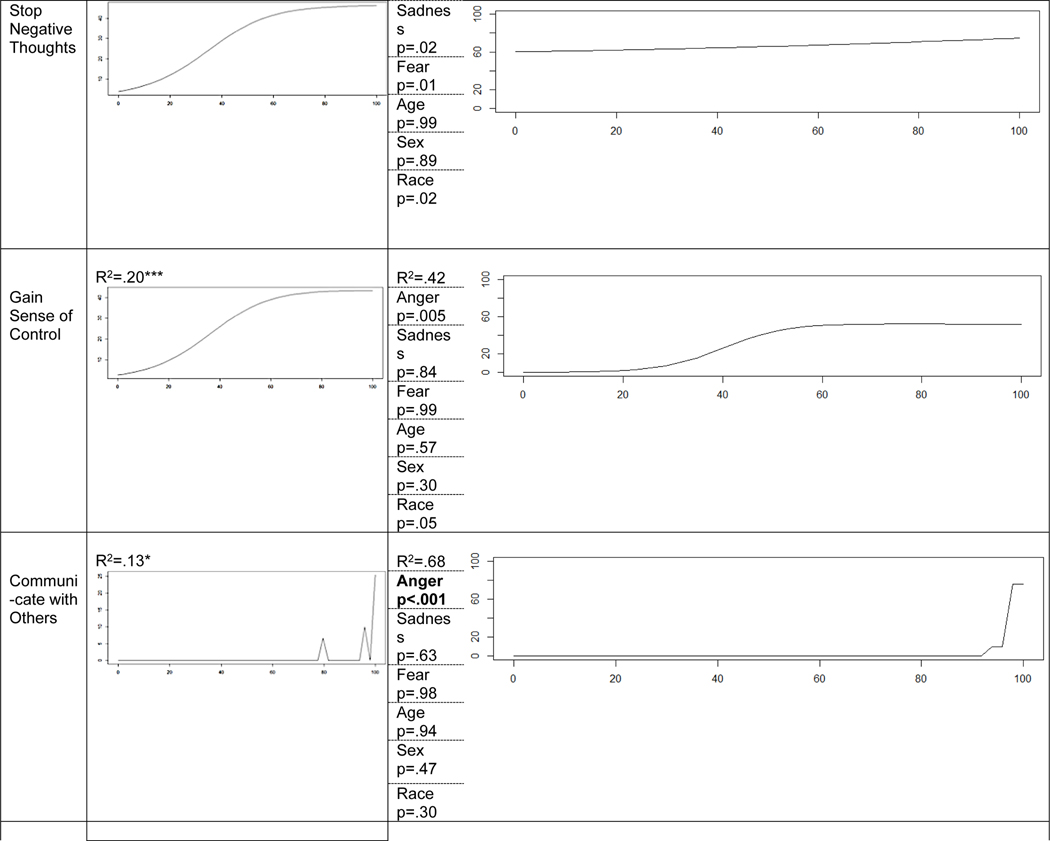
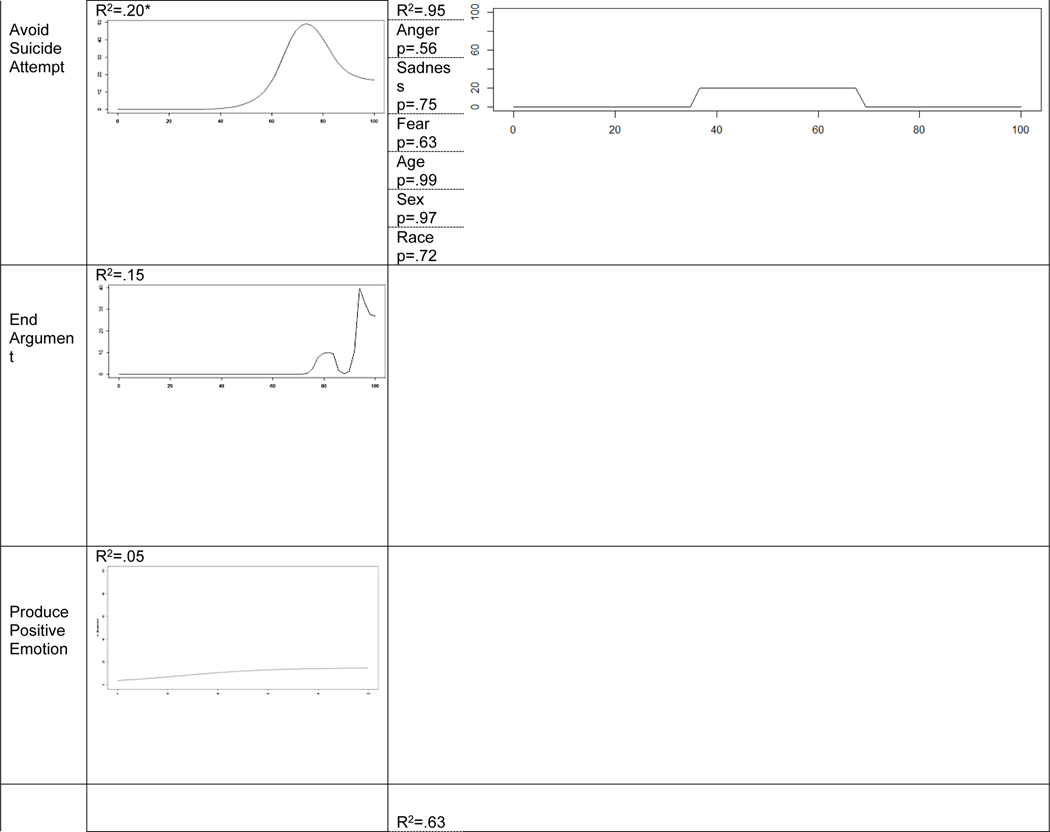
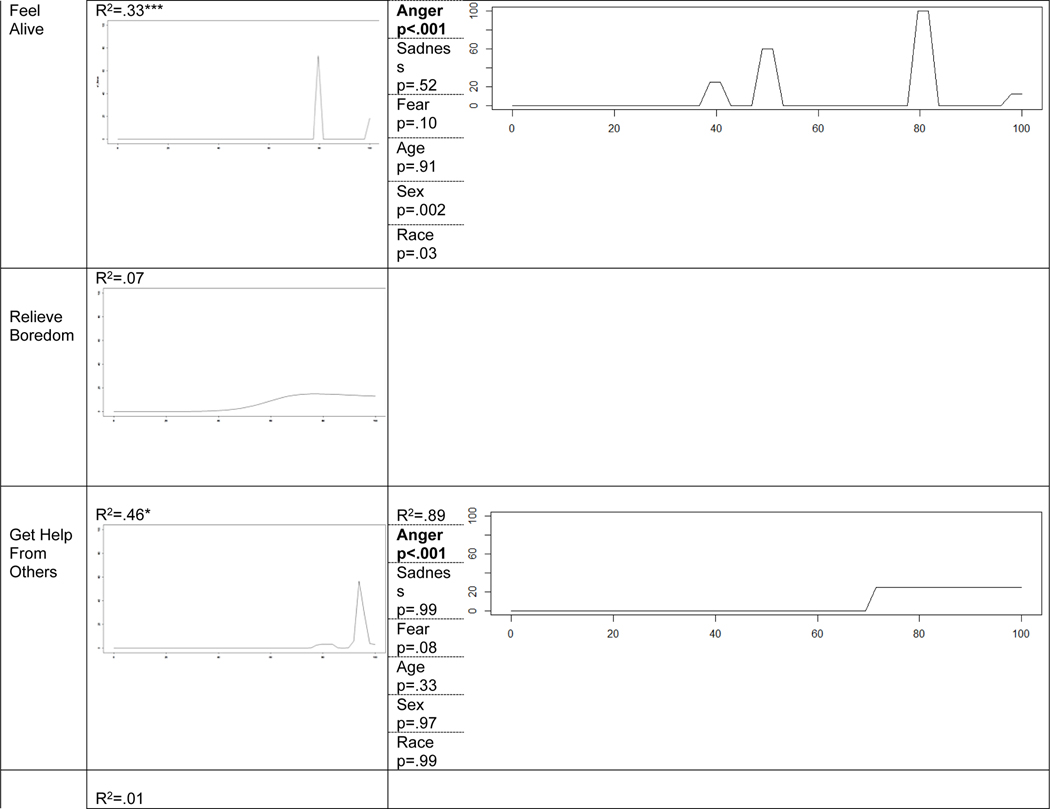
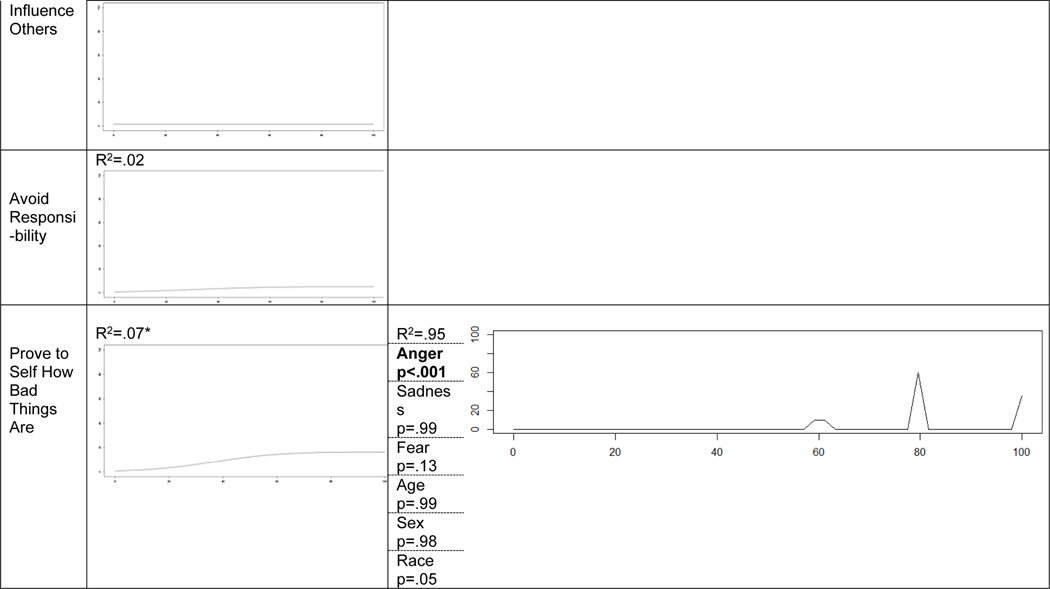
Table 1.
Anger Predicting Functions of NSSI
|
|
|
|
|
|
Note.
For all graphs the x-axis is the percent of time anger experienced antecedent to NSSI and the y-axis is the percent of time NSSI fulfilled a given function. All adjusted models are also controlling for age, sex, and race. Because Nonparametric Kernel Regression does not estimate parameters, there is no single coefficient to report for these predictors. P-values calculated with independent and identically distributed (IID) boostrapping with 399 replications. Bolded Anger p-values reflect significant association at p<.05 after Bonferroni correction for 12 tests (i.e., p<.004).
p < .001
p < .01
p < .05
