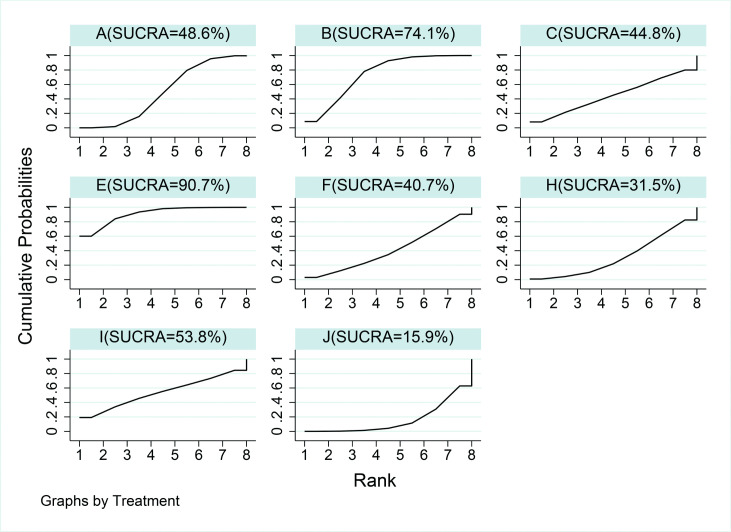
Figure 3.
Rankings for effects on knee adduction angular impulse. The graph displays the distribution of probabilities for each treatment. The X-axis represents the possible rank of each treatment (from the best to worst according to the outcomes), Y-axis represents the cumulative probability for each treatment to be the best option, among the best two options, among the best three options and so on. A, control condition; B, lateral wedge insole; C, knee brace; E, gait retraining; F, quadriceps strengthening; H, hip strengthening; I, lower limb exercise; J, neuromuscular exercise; SUCRA, surface under the cumulative ranking curve.

