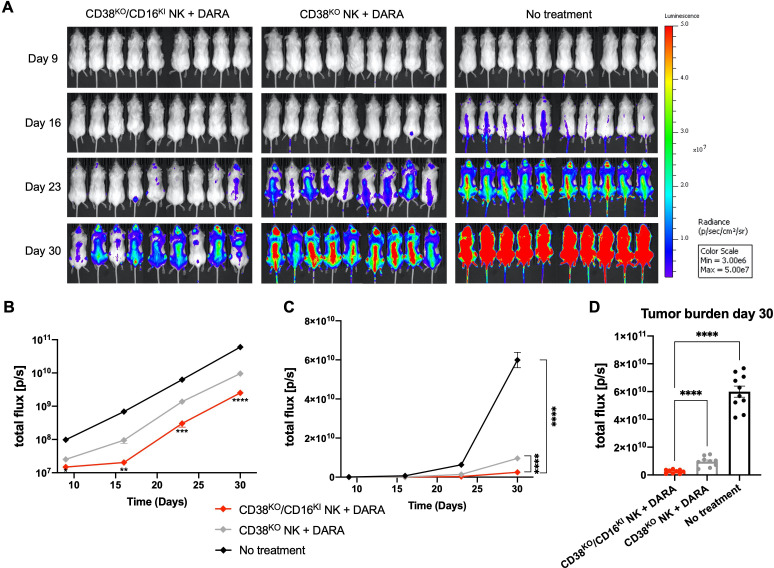
Figure 7.
CD38KO/CD16KI NK cells demonstrate enhanced anti-myeloma function in vivo. (A) Bioluminescence images show mice in each treatment group at 9, 16, 23, and 30 days after myeloma inoculation. (B) Logarithmic scale and (C) linear scale of bioluminescent quantification of MM.1S myeloma tumor growth across all time points (n=9 in treatment groups and n=10 in the no treatment group). (D) Bioluminescent quantification of MM.1S myeloma tumor growth shown in individual mice within each group at day 30. Statistics determined with the Student’s t-test, two tailed, *p<0.05, **p<0.01, ***p<0.001, ****p<0.0001. DARA, daratumumab; KO, knockout; KI, knock-in; NK, natural killer.

