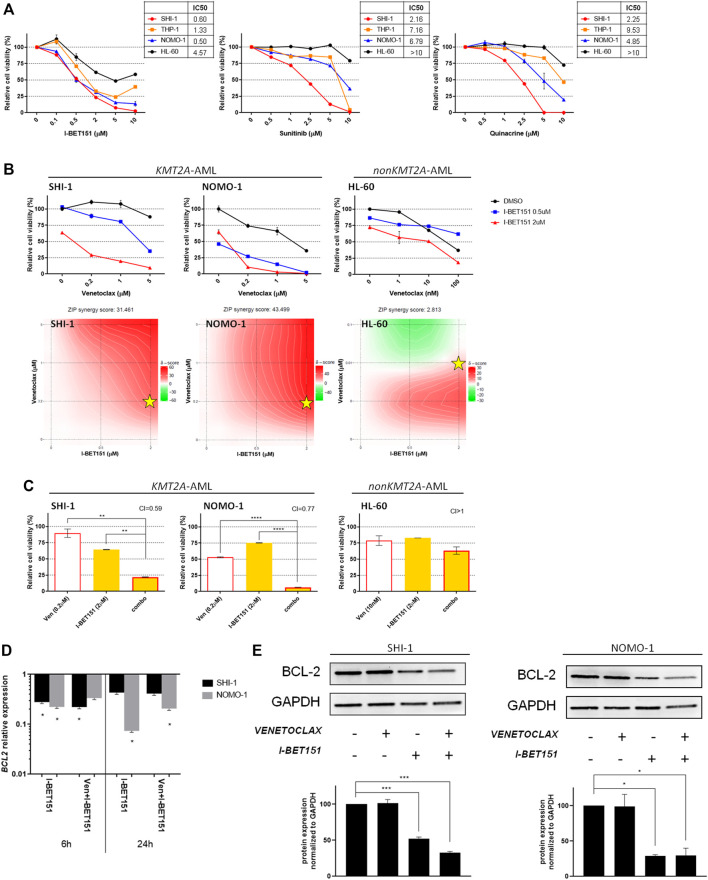
FIGURE 2.
Combination of venetoclax and I-BET151. (A) Dose–response curve of growing concentrations of I-BET151, sunitinib, and quinacrine in KMT2A-rearranged acute myeloid leukemia (AML; SHI-1, THP-1, and NOMO-1) and non-KMT2A-rearranged AML (HL-60) cell lines at 72 h after treatment (n = 2). (B) Cell viability of SHI-1 and NOMO-1 (KMT2A-rearranged) or HL-60 (non-KMT2A-rearranged) after treatment with I-BET151 combined with venetoclax at 48 h after treatment. The synergy scores were represented by pseudocoloring 2-dimensional contour plots over the dose matrix (red indicates synergy and green indicates antagonism) and calculated using the ZIP model (synergy when >10, n = 2). Stars indicate the concentrations selected for subsequent experiments. (C) Cell viability of SHI-1 and NOMO-1 (KMT2A-rearranged) or HL-60 (non-KMT2A-rearranged) after treatment with venetoclax, I-BET151, or the combination at 48 h after treatment (CI, combination index; synergy when CI <1. ANOVA test was performed by applying Bonferroni correction for multiple statistical hypotheses testing. **p < 0.01, ****p < 0.0001; n = 2). (D) BCL2 expression measured by RQ-PCR at 6 and 24 h post-treatment in SHI-1 and NOMO-1 with respect to control. ANOVA test was performed by applying Bonferroni correction for multiple statistical hypotheses testing. *p < 0.05; n = 2 (E) BCL-2 levels measured at 48 h post-treatment in SHI-1 and NOMO-1. Histograms report the quantification normalized to GAPDH. ANOVA test was performed by applying Bonferroni correction for multiple statistical hypotheses testing. *p < 0.05, ***p < 0.001; n = 2.

