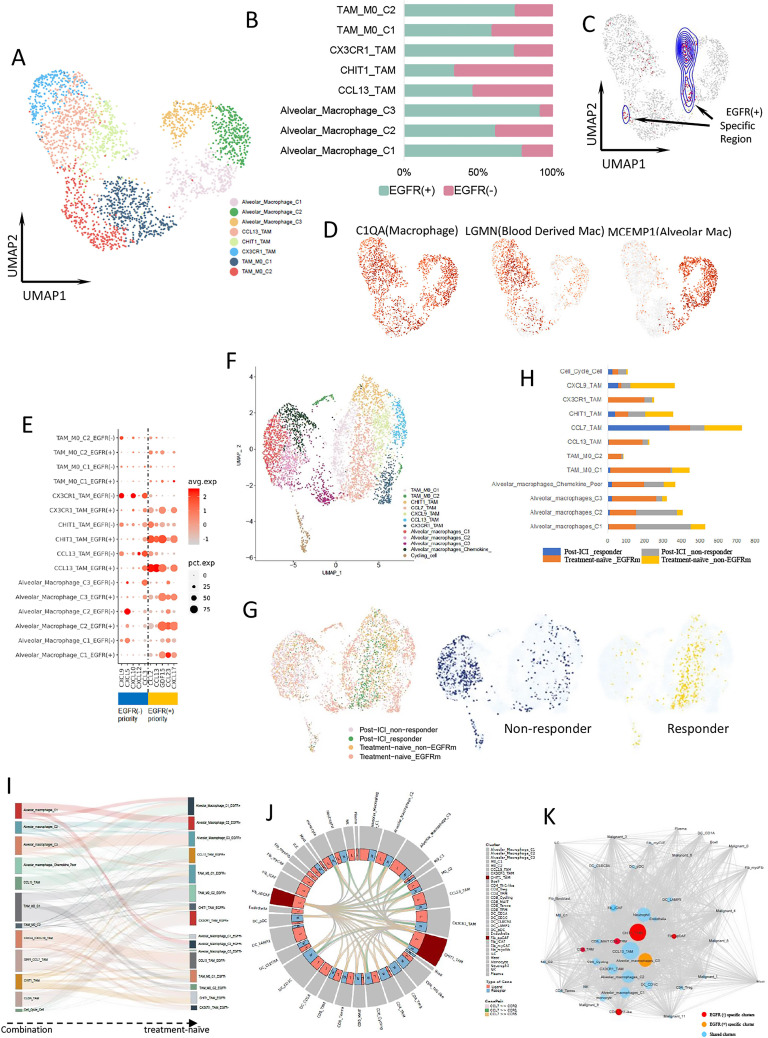
Figure 4.
Macrophage expression differs by EGFR mutation status. (A) UMAP plot of 2649 macrophages from treatment-naïve samples. (B) The proportion of each macrophage cluster in EGFR(−) (pink) and EGFR(+) (cyan) group. (C) UMAP plot of macrophages from EGFR(+)-specific region calculated by DASeq. (D) Expression of marker genes for macrophages, blood-derived macrophages, and alveolar macrophages. (E) Bubble plot of cytokine expression among macrophage clusters from different group. (F) UMAP plot of pooled macrophages in both treatment-naïve and post-treatment samples. (G) UMAP plot of pooled macrophages from post-ICI responder, post-ICI non-responder, treatment-naïve EGFR-mutant, and treatment-naïve EGFR-negative samples, respectively (left). The macrophages from responder (middle) and non-responder (right) were separately distributed. (H) The proportion of different macrophage cluster from post-ICI responder, post-ICI non-responder, treatment-naïve EGFR-mutant, and treatment-naïve EGFR-negative samples, respectively. (I) Macrophage clusters comparation between combination samples and treatment-naïve samples. (J) CHIT1_TAM interacted with other immune cells, including CD8+ T cells through CCL7 and its receptors binding. (K) Cellular interaction network for all LUAD cell types constructed based on the CellPhoneDB results. Lines represent the relationship between two clusters in terms of cytokine expression. Node size reflects the strength of the relationship. Red nodes represent EGFR(−)-specific clusters, orange nodes represent EGFR(+)-specific clusters, and blue nodes represent sharing clusters from both groups. EGFR, epidermal growth factor receptor; ICI, immune-checkpoint inhibitor; TAM, tumor-associated macrophage.

