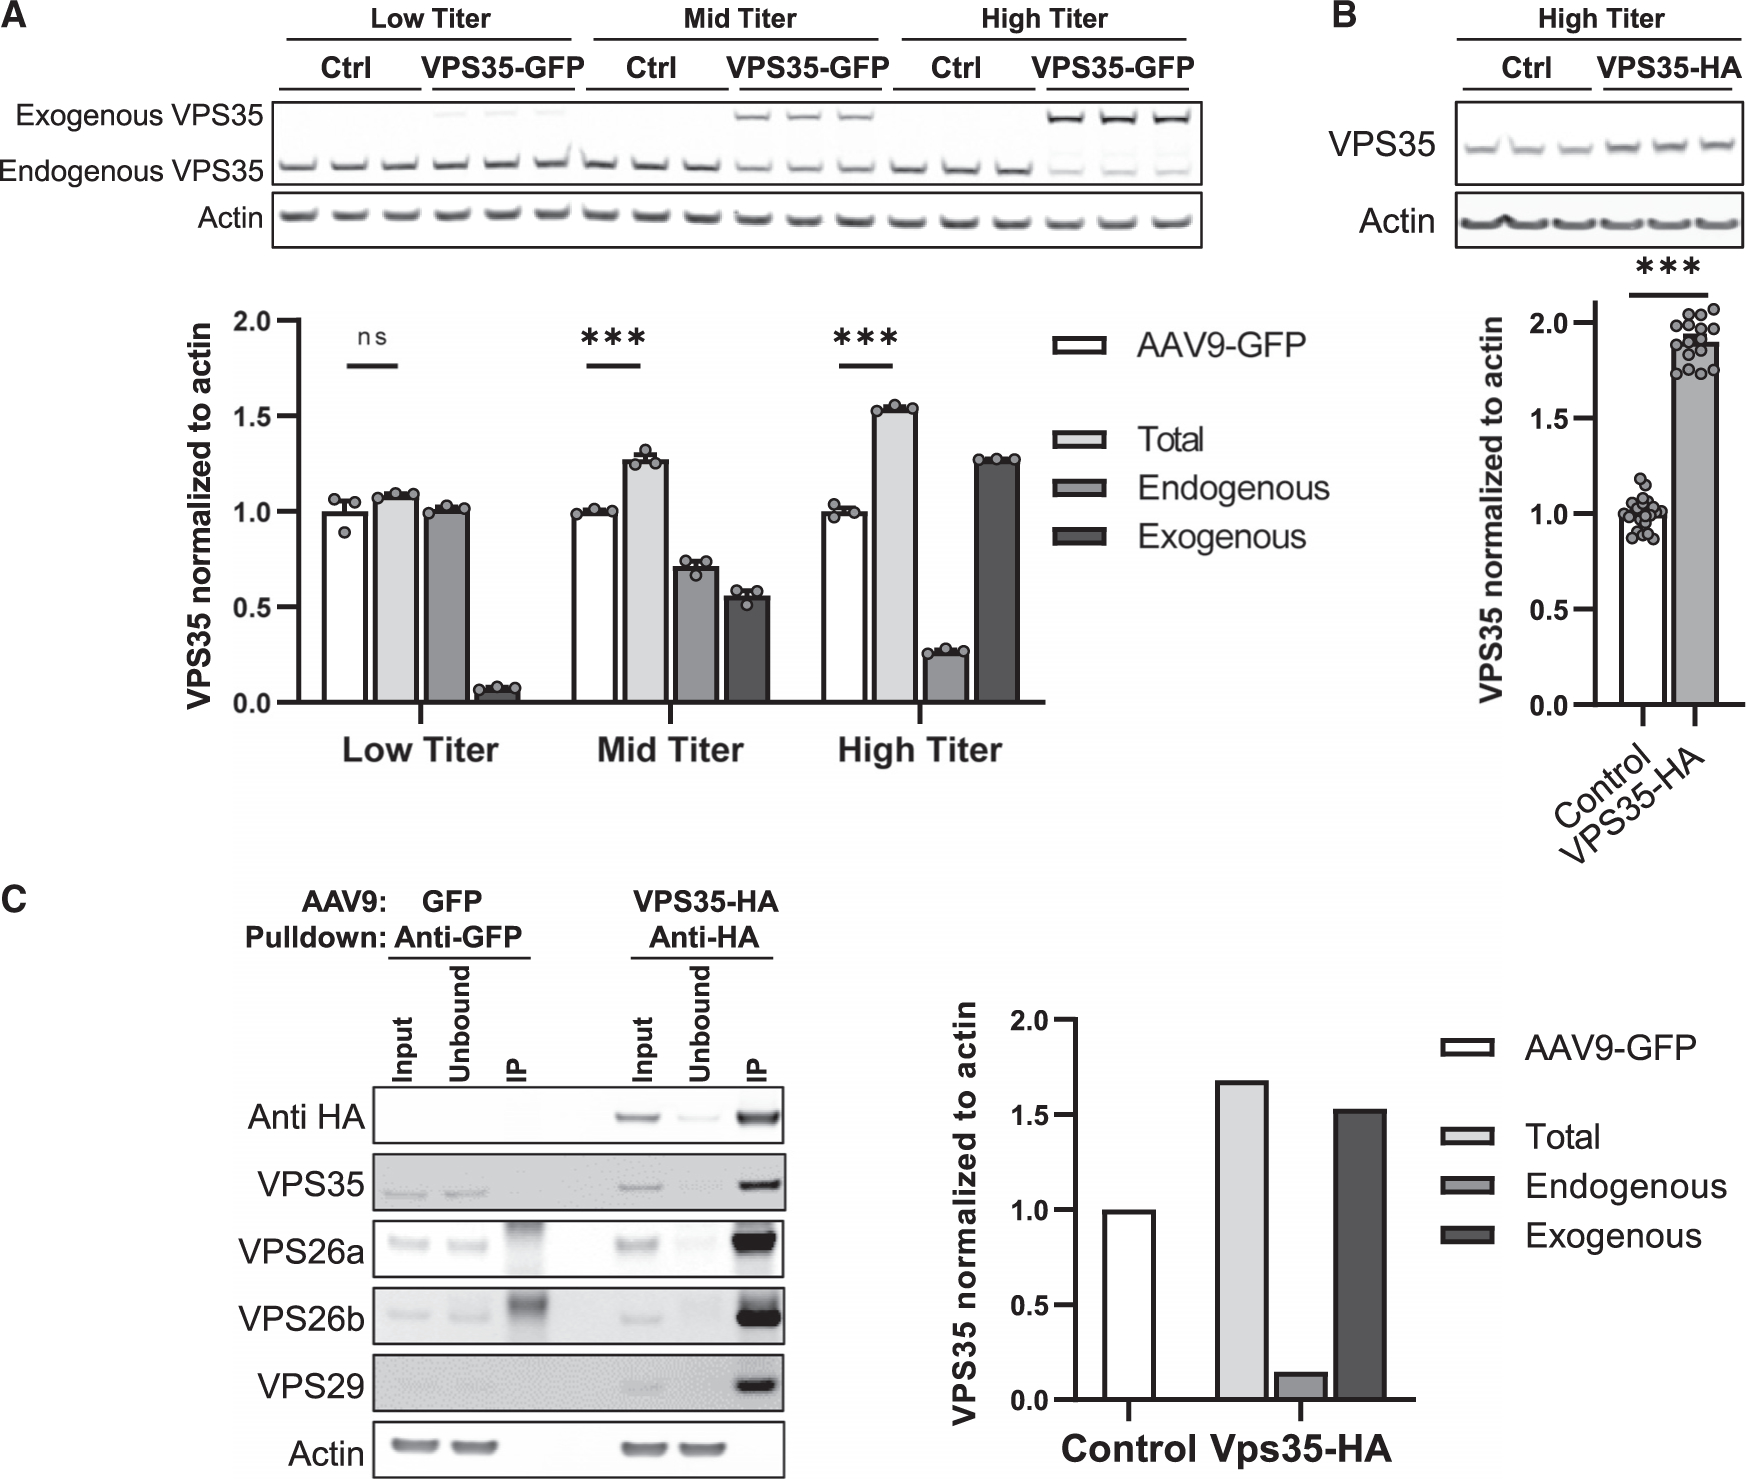
Figure 2. The effects of AAV9-VPS35 on the endogenous neuronal retromer.

(A) Immunoblots showing expression levels of exogenous and endogenous VPS35 after delivery of three doses of AAV9-VPS35-GFP in primary neuronal culture (5E+9 vg/well, 2E+10 vg/well, 1E+11 vg/well), and after delivery of AAV9-GFP as a control. Bar graphs show the mean levels of total VPS35 (light gray bars), endogenous VPS35 (medium gray bars), exogenous VPS35 (black bars). Mean level of VPS35 with AAV9-GFP expression (white bars) is shown as control (n = 3).
(B) Representative immunoblots showing expression levels following AAV9-VPS35-HA at 1E+11 vg/well (n = 16). Bar graphs show mean levels, normalized by actin; AAV9-GFP and AAV9-EV (empty vector) were used as controls (n = 23).
(C) Immunoblots showing that anti-HA antibody co-immunoprecipitated endogenous retromer core proteins VPS26a, VPS26b, and VPS29. Bar graphs represent levels of VPS35, total (light gray; input), endogenous VPS35 (medium gray; unbound), and exogenous VPS35 (black; unbound subtracted from input) extracted from the co-immunoprecipitation data (right three bands on blots). Control bar (white; input from the control reaction (left three bands on the blots)). All primary neurons were cultured from C57BL/6J mice at postnatal day 0.
See also Figure S2. n = biological replicates. Data are represented as mean ± SEM. ***p < 0.001, ns = not significant.
