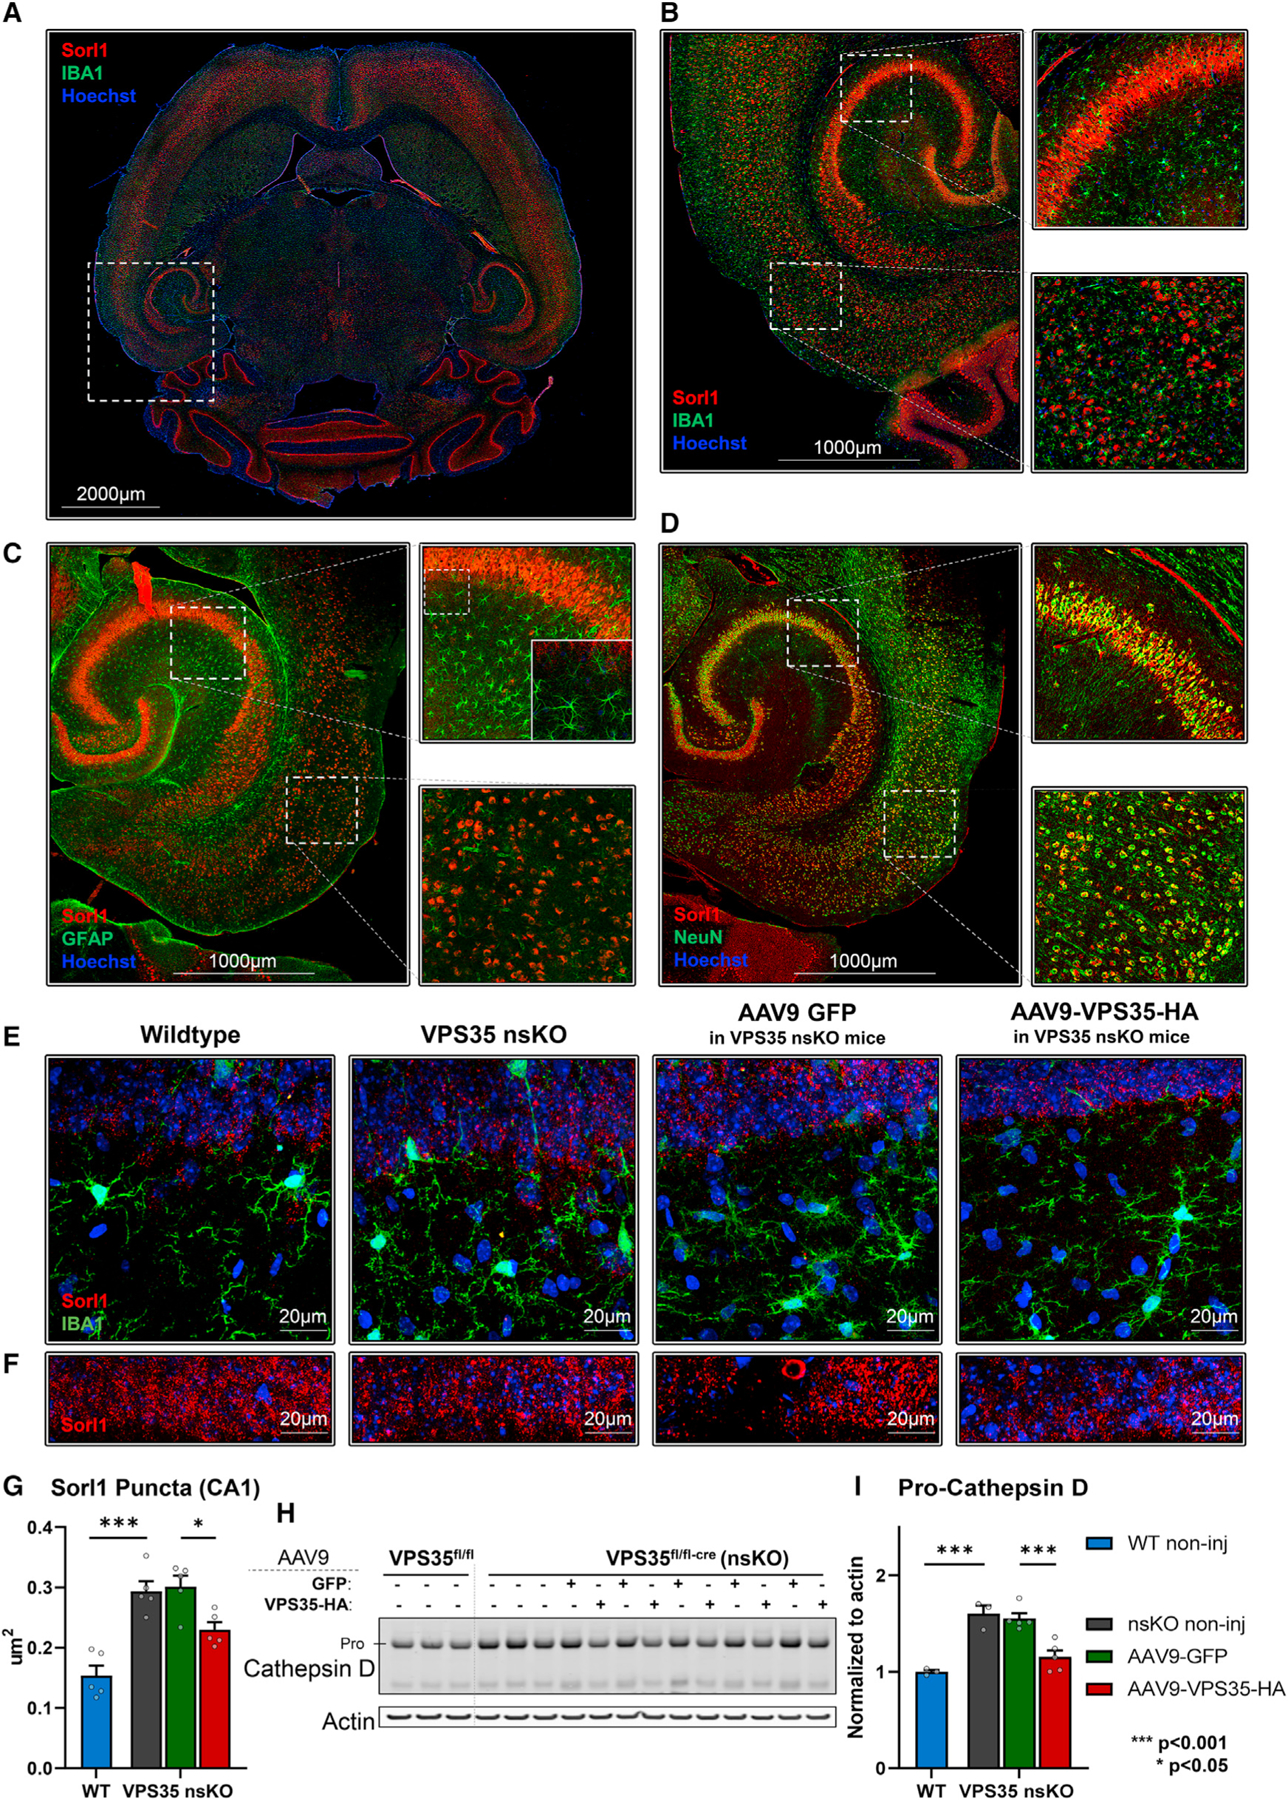
Figure 5. AAV9-VPS35 normalizes SORL1 and cathepsin D defects in hippocampal neurons.

(A) Axial brain section immunofluorescently stained with Sorl1 and co-stained with microglial marker IBA1.
(B and C) (B) Hippocampal and EC areas of the mouse brain showing a lack of colocalization between Sorl1 and IBA1, and (C) Sorl1 and GFAP.
(D) Strong colocalization was observed with neuronal marker NeuN in the cortex and hippocampus.
(E) 63x z-projection images showing Sorl1 and IBA1 co-staining in wild-type (VPS35fl/fl, n = 5), VPS35 nsKO (n = 5), VPS35 nsKO mice with AAV9 GFP injection (n = 5), VPS35 nsKO mice with AAV9 VPS35-HA injection (n = 5).
(F) 63x z-projection images showing Sorl1 staining in wild-type (VPS35fl/fl, n = 5), VPS35 nsKO (n = 5), VPS35 nsKO mice with AAV9 GFP injection (n = 5), VPS35 nsKO mice with AAV9 VPS35-HA injection (n = 5).
(G) Quantification of Sorl1 puncta size for (F).
(H) Immunoblots from the CA1 region of WT (VPS35fl/fl, n = 3) and VPS35 nsKO (n = 8) mice (6 months of age) showing cathepsin D and actin protein levels. AAV9-GFP and AAV9-VPS35-HA were injected in left and right CA1 respectively in five of the VPS35 nsKO mice at 3 months.
(I) Bar graphs represent actin-normalized levels of Pro-cathepsin D (upper band).
See also Figure S4. n = biological replicates. Data are represented as mean ± SEM. *p < 0.05, ***p < 0.001.
