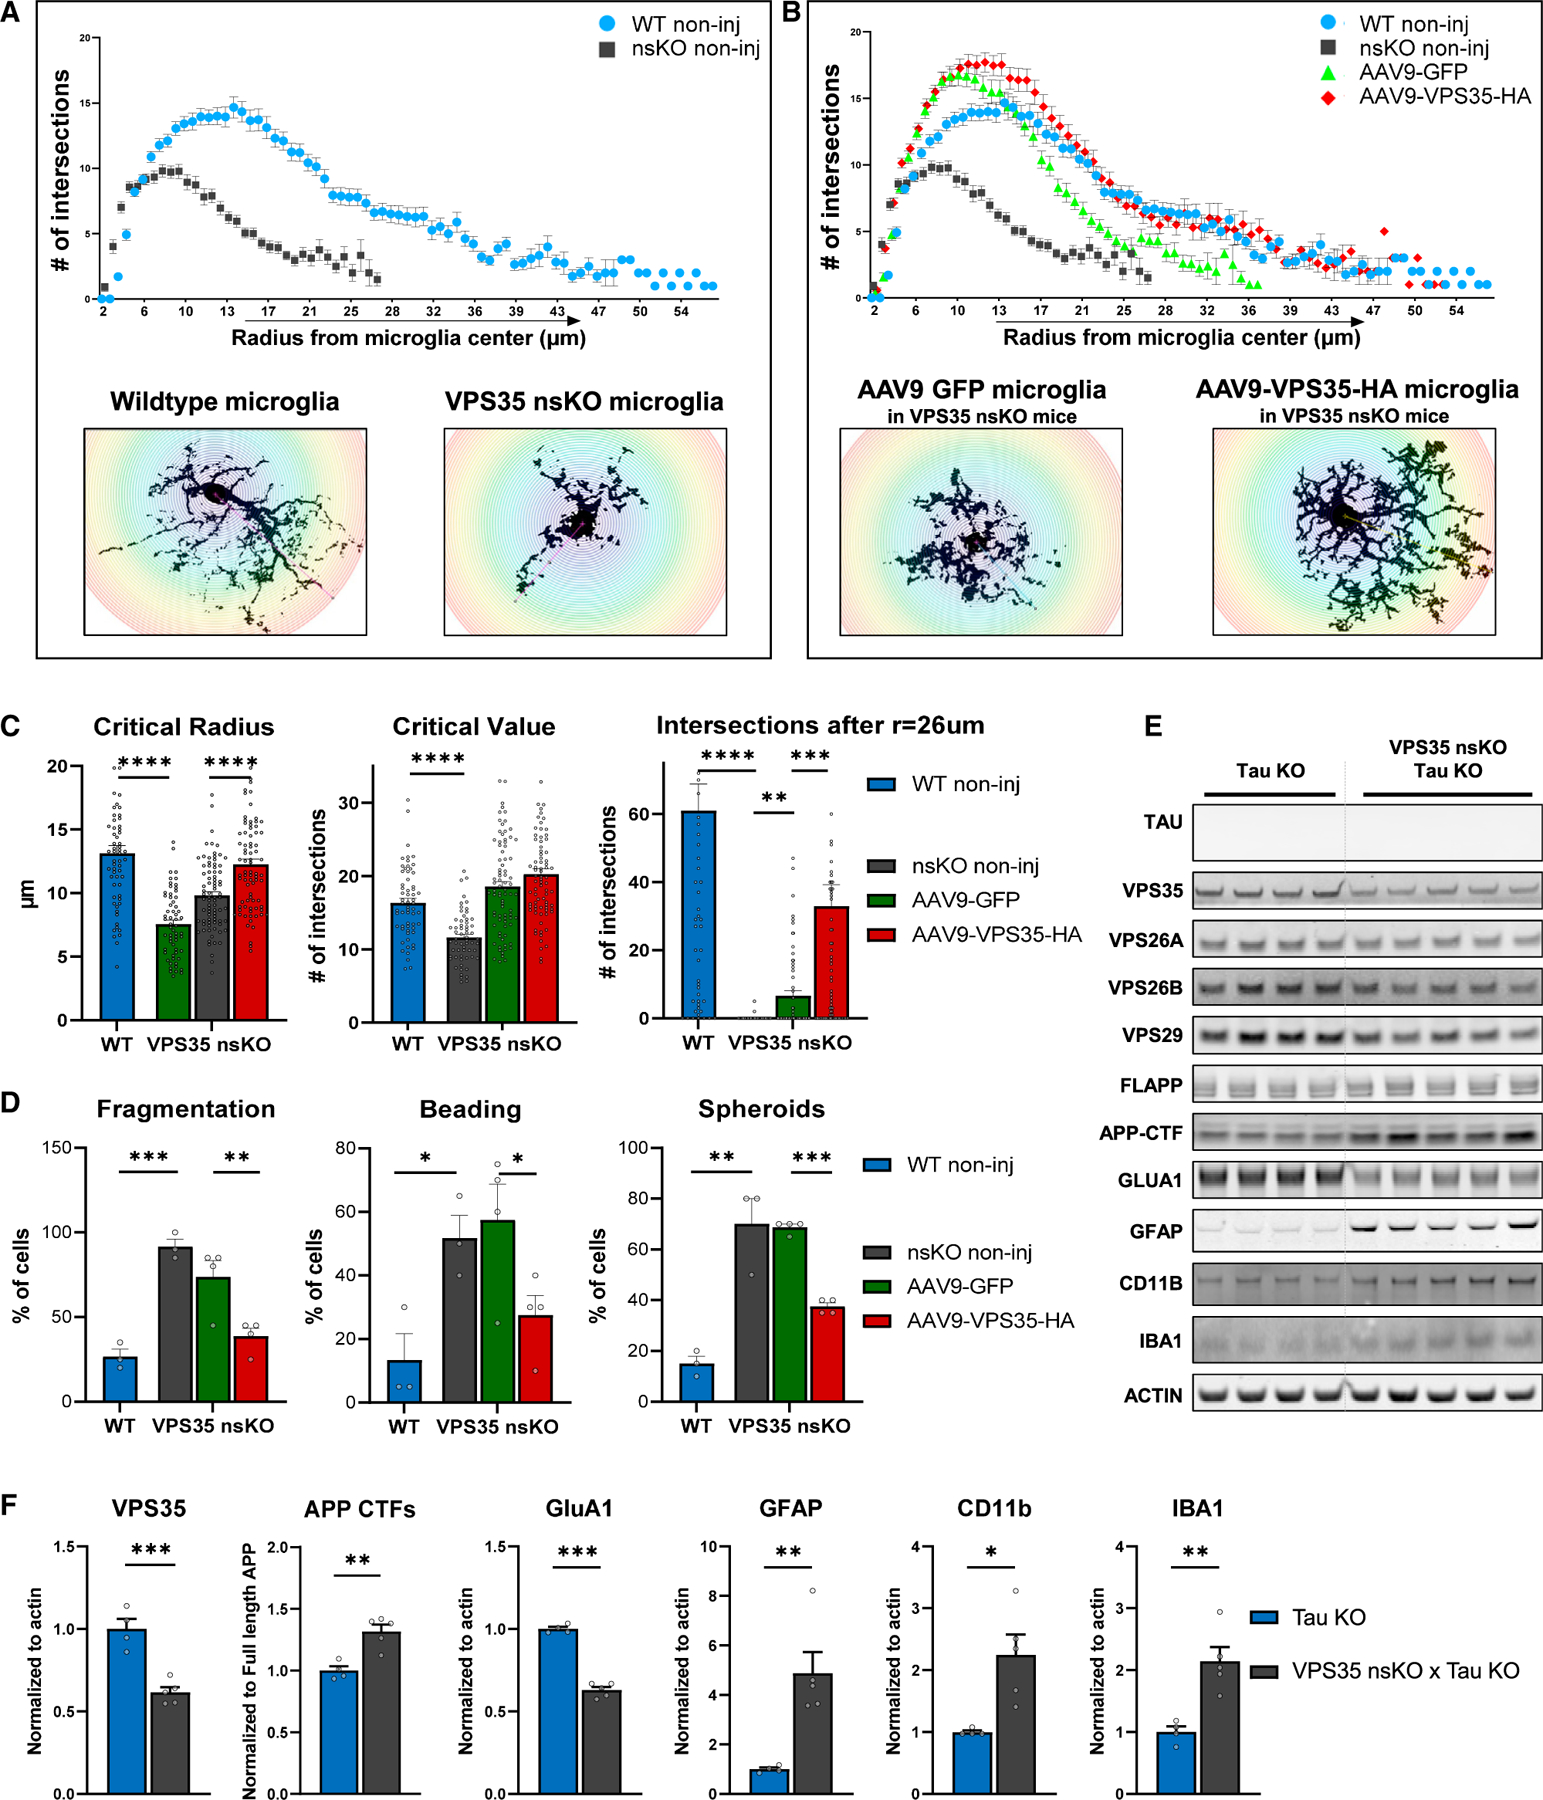
Figure 7. Neuronal VPS35 regulates an Alzheimer’s-associated microglial morphological phenotype.

(A) Brains from 6-month-old WT (VPS35fl/fl, n = 3, two females and one male) and VPS35 nsKO mice (n = 3, two females and one male) were harvested and the dorsal hippocampus region was stained with microglial marker IBA1. Microglial morphology was analyzed using ImageJ’s Sholl plugin (n = 60 per condition, 20 cells per animals). Number of branches intersecting the Sholl shells were plotted against the radius of the respective Sholl shell to generate curves. Representative images of microglial cells are included in insets.
(B) Data from (A) are combined with microglial analysis from brains of 6-month-old VPS35 nsKO mice (n = 4, three females and one male) that were injected at 3 months of age with AAV9-GFP and AAV9-VPS35-HA in left and right dorsal CA1, respectively. Brains were harvested and the dorsal hippocampus region was stained with microglial marker IBA1. Microglial morphology was analyzed using ImageJ’s Sholl plugin (n = 80 per condition, 20 from left, and 20 from right dorsal hippocampus, total 40 cells per animal). Number of branches intersecting the Sholl shells were plotted against the radius of the respective Sholl shell to generate curves. Representative images of microglial cells are included in insets.
(C) Critical radius, defined as the radius of a Sholl shell from the cell center (left), at which the critical value occurs, and (middle) critical value, which is the highest number of branches intersecting a Sholl shell. Right: Number of total intersections per cell, after radius of 26 μm from the center of the cell body, was calculated and analyzed.
(D) Left: The percentage of total microglial cells with fragmented processes. Mid; The percentage of total microglial cells with beaded processes. Right: The percentage of total microglial cells with spheroid formation.
The number of animals for these studies (C and D) is the same as described in (A) and (B). 20 microglial cells were analyzed from each of the 14 dorsal hippocampi included in the study: total = 280 microglial cells. See also Figure S6.
(E) Immunoblots from of the CA1 region of Tau KO animals (Tau KO + VPS35fl/fl, n = 4) and Tau KO + VPS35 nsKO (n = 5) mice (6–8 months of age) were probed for VPS35, VPS26A, VPS26B, VPS29, full-length APP, total C-terminal fragments of APP (APP CTFs), GluA1, astrocyte marker glial fibrillary acidic protein (GFAP), and the microglial markers ionized calcium-binding adapter molecule 1 (IBA1) and CD11 antigen-like family member B (CD11b) and actin protein levels. (F) Bar graphs represent actin-normalized levels of VPS35, total C-terminal fragments of APP (APP CTFs), GluA1, GFAP, CD11b, and IBA1 from (E). n = biological replicates. Data are represented as mean ± SEM. *p < 0.05, **p < 0.01, ***p < 0.001, ****p < 0.0001.
