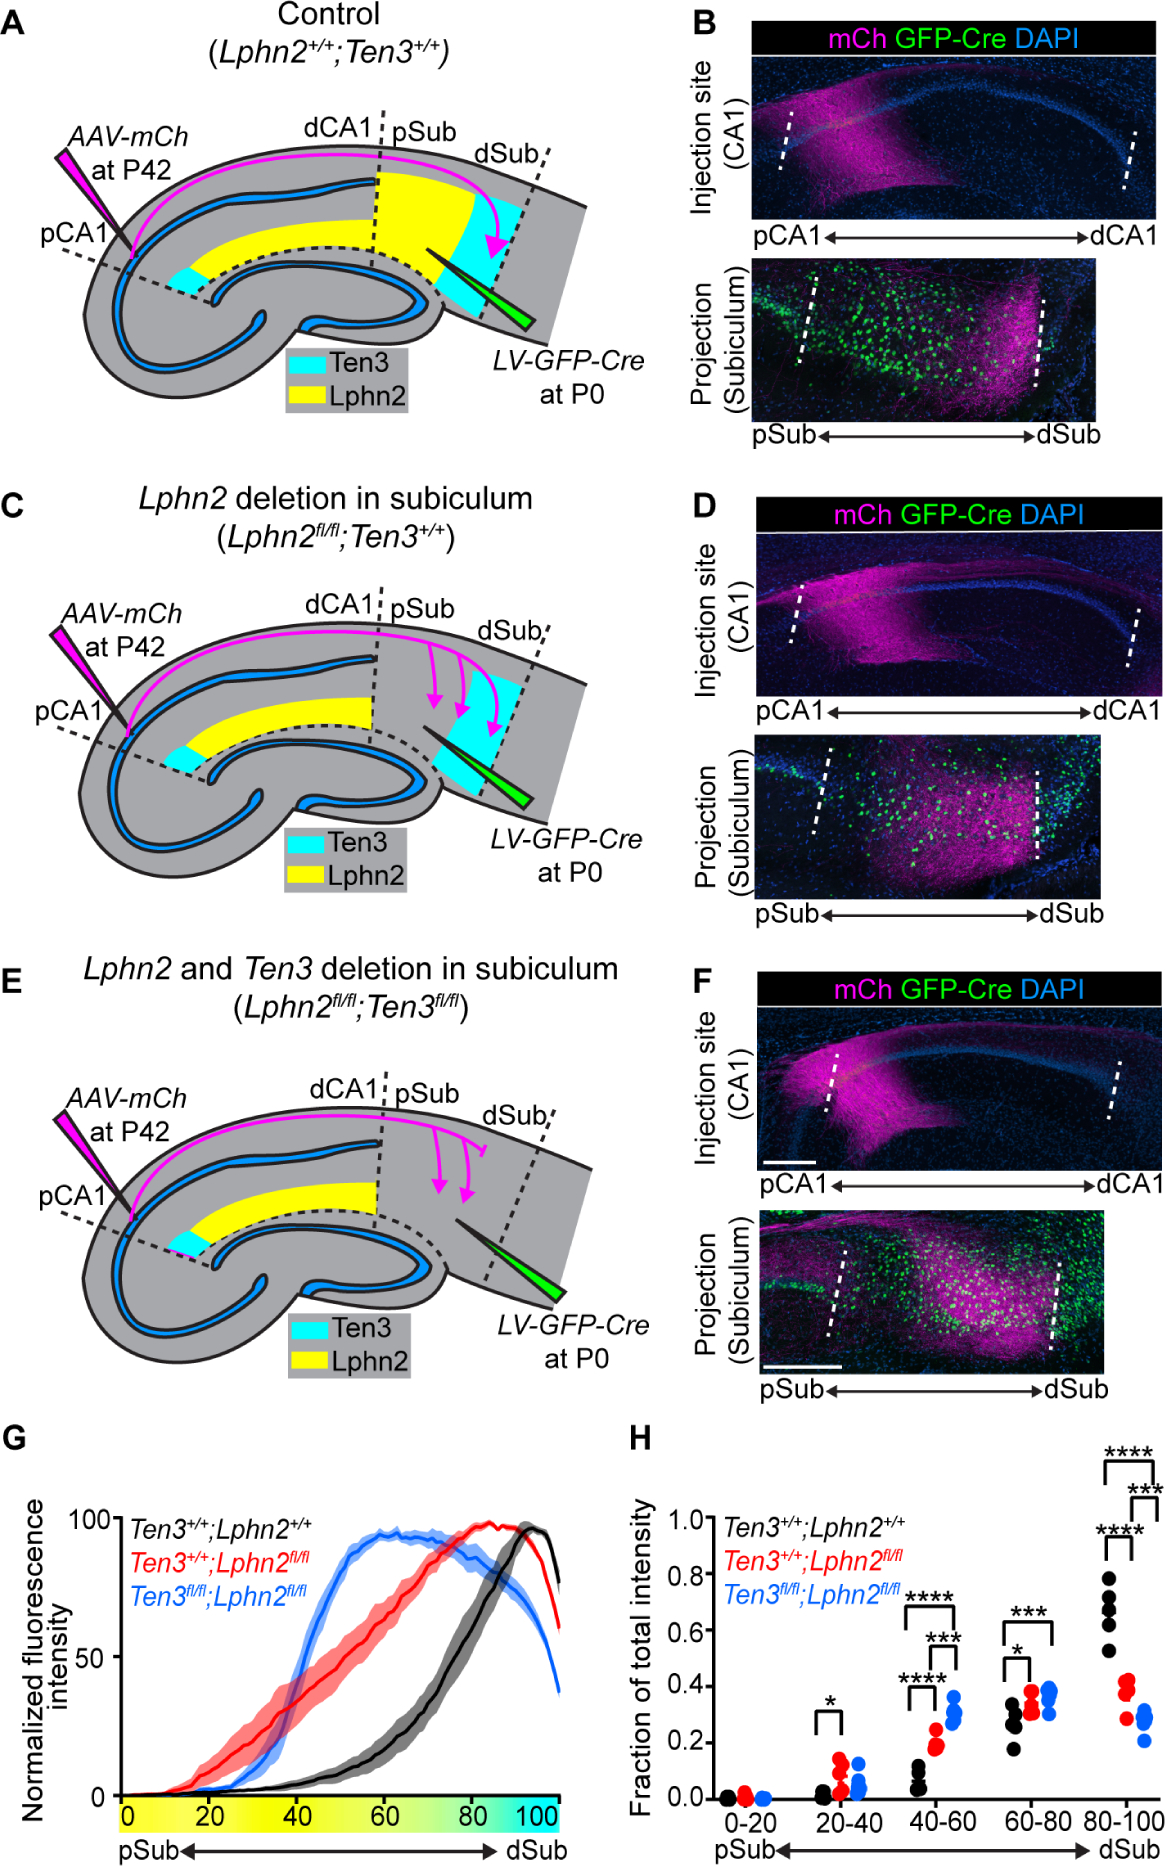
Fig. 3. Lphn2/Ten3-mediated repulsion and Ten3/Ten3-mediated attraction cooperate to guide proximal CA1→distal subiculum target selection.

(A, C, E) Experimental design and summary of results for control (A), Lphn2 conditional knockout in subiculum (C), and Lphn2 and Ten3 double conditional knockout in subiculum (E). (B, D, F) Representative images of AAV-mCh (magenta) injections in proximal CA1 (top) and corresponding projections of proximal CA1 axons overlapping with LV-GFP-Cre (green) injection sites in subiculum (bottom). Data in (B), (D), and (F) correspond to experimental conditions in (A), (C), and (E), respectively. (G) Normalized mean fluorescence intensity traces of subiculum projections from proximal CA1 in GFP-Cre+ sections for Lphn2+/+;Ten3+/+ (n = 5 mice), Lphn2fl/fl;Ten3+/+ (n = 5 mice) and Lphn2fl/fl;Ten3fl/fl (n = 6 mice). Mean ± SEM. Color bar under x-axis represents Lphn2 (yellow) and Ten3 (cyan) expression in subiculum as quantified in Fig. 1F. (H) Fraction of total axon intensity for the same data as (G) across 20 percent intervals. Mean ± SEM, two-way ANOVA with Sidak’s multiple comparisons test. ****P ≤ 0.0001; *** P ≤ 0.001; * P ≤ 0.05. Scale bar, 200 μm. Injection site locations in CA1 are shown in fig. S11.
