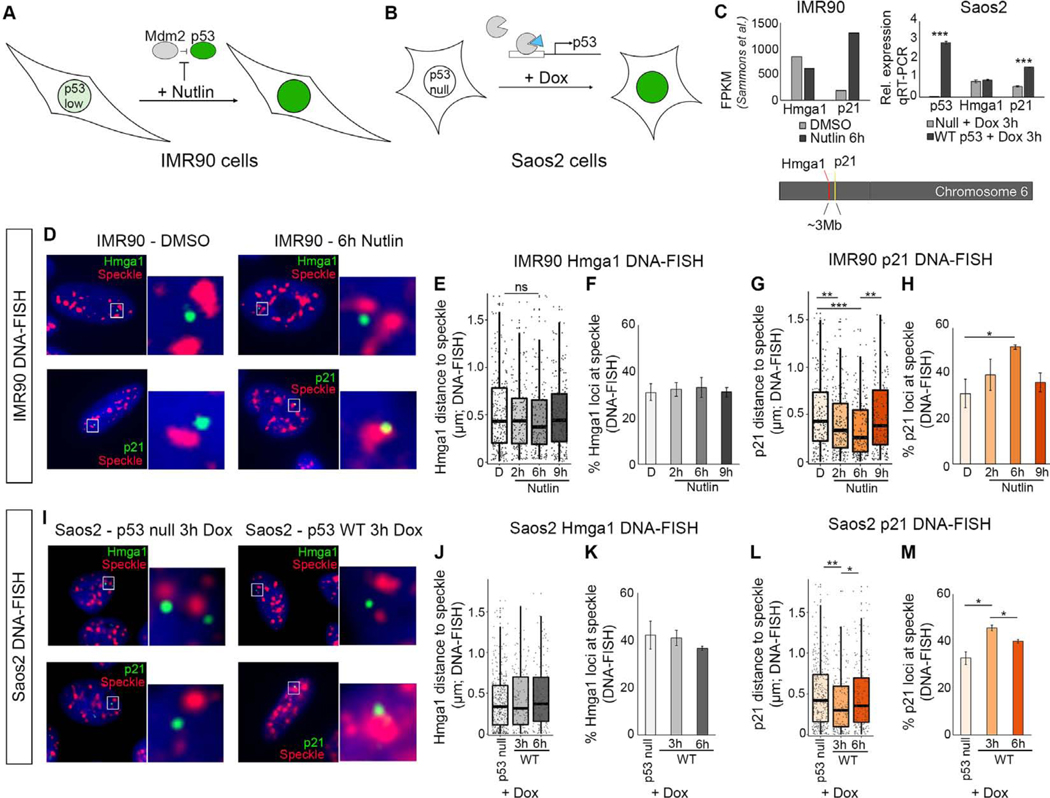
Figure 1. p21 becomes speckle associated upon p53 activation.
(A) Model of IMR90 cells treated with Nutlin-3a to activate p53.
(B) Model of Saos2 p53−/− cells treated with doxycycline to activate expression of p53 transgene.
(C) Chromosome locations of p21 and Hmga1 (bottom). RNA-seq FPKM values in IMR90 cells (top left), and qRT-PCR showing expression relative to Gapdh.
(D) ImmunoDNA-FISH of Hmga1 (top; green) and p21 (bottom; green) genes with nuclear speckle immunofluorescence (red) and DAPI DNA staining (blue).
(E) Distribution of Hmga1 loci distance to the nearest speckle in IMR90 cells.
(F) Percentage of Hmga1 loci at the speckle in IMR90 cells.
(G) Distribution of p21 loci distances to the nearest speckle in IMR90 cells.
(H) Percentage of p21 loci at the speckle in IMR90 cells.
(I) ImmunoDNA-FISH in Saos2 p53 null (left) or dox-inducible WT p53 cells (right).
(J) Distribution of Hmga1 loci distance to the nearest speckle in Saos2 cells.
(K) Percentage of Hmga1 loci at the speckle in Saos2 cells.
(L) Distribution of p21 loci distances to the nearest speckle in Saos2 cells.
(M) Percentage of p21 loci at the speckle in Saos2 cells.
*** - p < 0.0001, ** p < 0.01, * - p < 0.05, unlabelled - not significant.
D – DMSO treated.
For additional immunoFISH images, see Figure S1. For number of loci counted, see Table S1.

