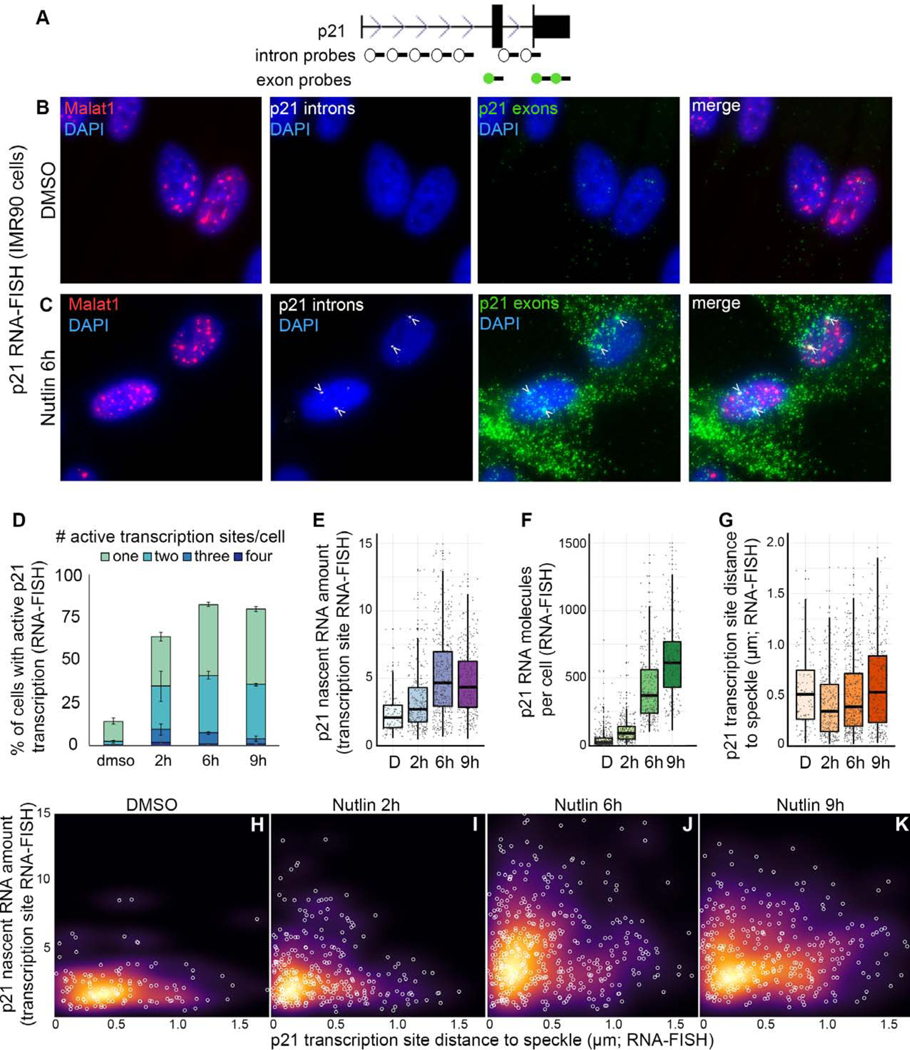
Figure 2. Relationship between speckle association and p21 expression.
(A) p21 probe locations.
(B and C) Maximum projection images of Malat1 speckle marker (red), p21 introns (white), and p21 exons (green) in IMR90 cells.
(D) Quantification of the number of active transcription sites per cell. Error bars represent standard error.
(E) Amount of nascent RNA. Each dot represents an individual transcription site.
(F) Number of p21 exon spots per cell. Each dot represents a single cell.
(G) Distribution of p21 active transcription site distances to the nearest speckle. Each dot represents an individual transcription site.
(H-K) Nascent RNA amount versus distance to speckle. Each white circle is an individual transcription site. Background color represents the density of data points.
D – DMSO treated.
For additional RNA-FISH images see Figure S2. For number of transcription sites and cells counted, see Table S1.

