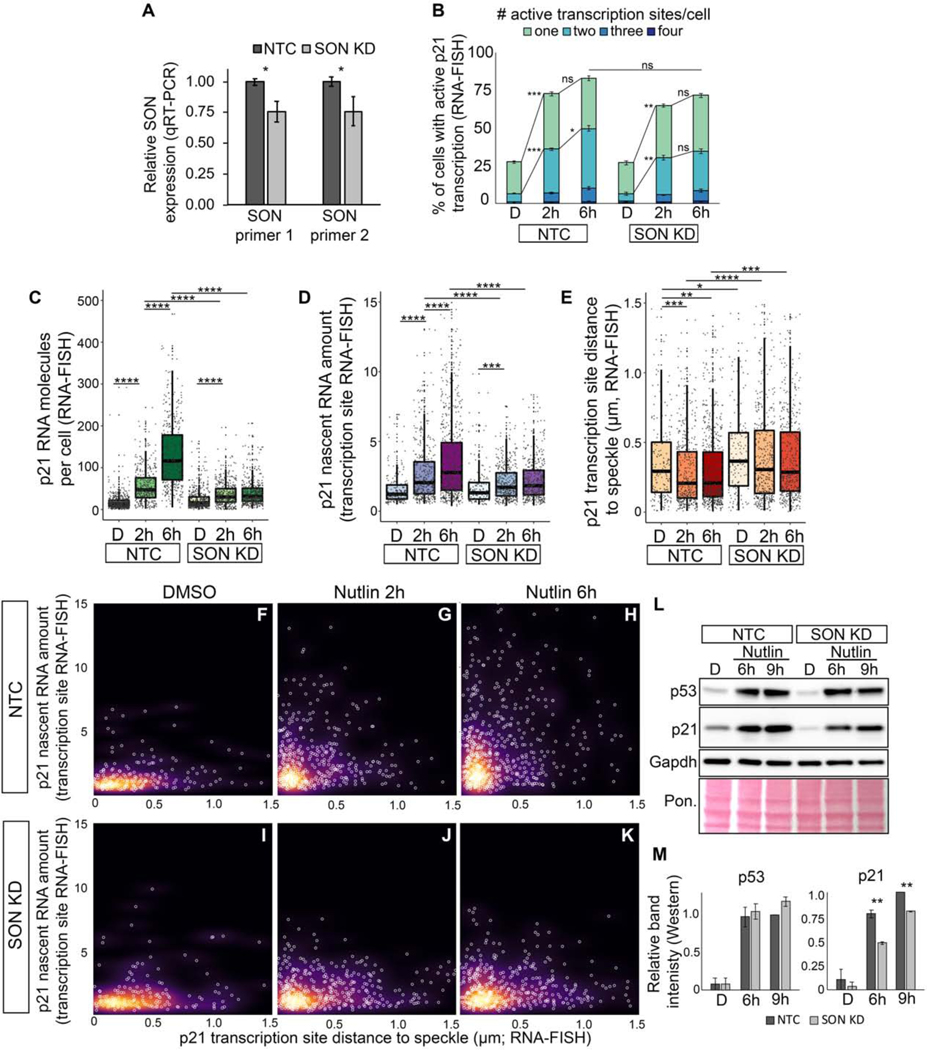
Figure 3. Knockdown of SON compromises p53-mediated induction of p21 expression and speckle association.
(A) qRT-PCR measuring SON RNA levels in IMR90 cells treated with a SON shRNA (SON KD) or non-targeting control (NTC).
(B) Percentage of cells with active transcription sites.
(C) Number of p21 exon spots per cell (p21 molecules per cell) in IMR90 cells.
(D) Nascent RNA amount in IMR90 cells.
(E) Distribution of p21 transcription site distances to the nearest speckle.
(F-K) Nascent RNA amount versus distance to speckle. Each white circle is an individual transcription site. Background color represents the density of data points.
(L) Western blot of p53, p21, and Gapdh. Total protein loading is shown by Ponceau (Pon.) staining.
(M) Quantification of protein levels based on L and Figure S3 of band intensity relative to Gapdh loading control and normalized to NTC 9h levels.
D – DMSO treated; 2h – Nutlin-3h 2 hour treated; 6h – Nutlin-3a 6h treated
* p < 0.05, ** p < 0.01, *** p < 0.001, **** p < 0.0001
For additional characterization of SON KD and for SRSF1 KD, see Figure S3. For number of transcription sites and cells counted, see Table S1.

