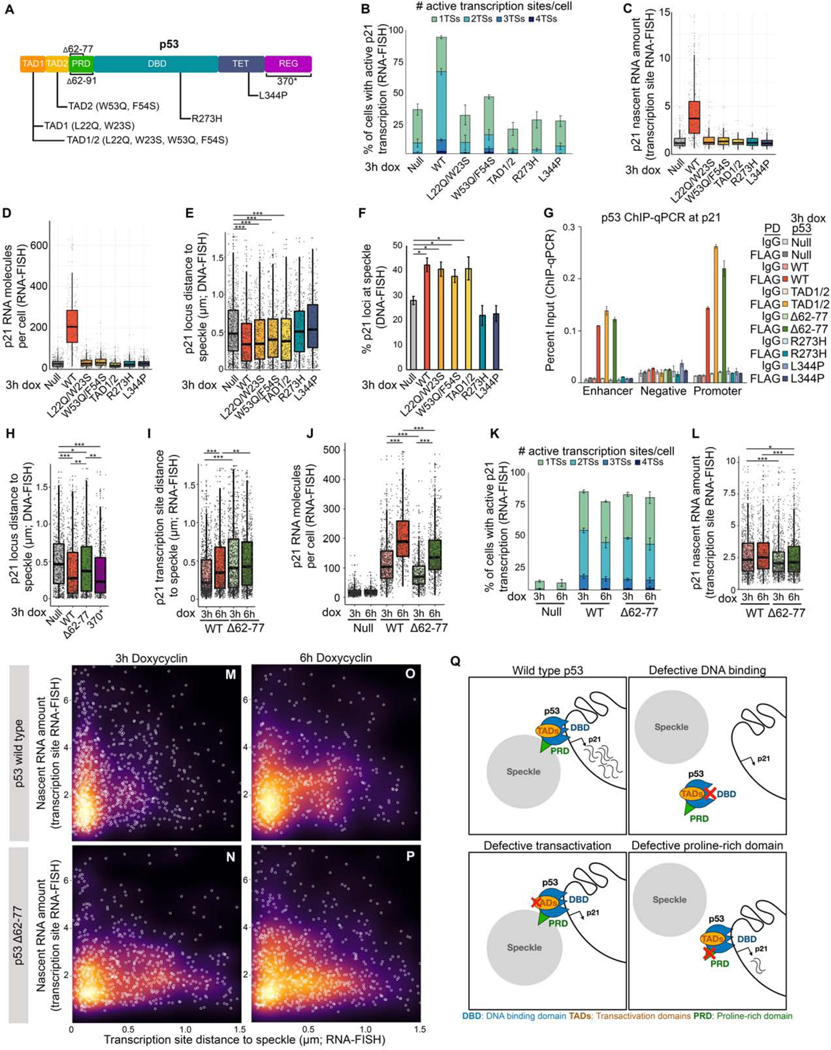
Figure 4. p21 speckle association by p53 requires p53 DNA binding and proline rich domains, but not p53 transactivation functions.
(A) p53 protein domains and mutations. TAD – transactivation domain, PRD – proline-rich domain, DBD – DNA-binding domain, TET – tetramerization domain, REG – regulatory domain.
(B) Percentage of cells with active transcription sites as measured by RNA-FISH.
(C) p21 nascent transcript amount as measured by RNA-FISH.
(D) Distribution of the number of p21 molecules per cell as measured by RNA-FISH.
(E) Distribution of p21 loci distances to the nearest nuclear speckle as measured by immunoDNA-FISH.
(F) Percent p21 loci at nuclear speckles measured by immunoDNA-FISH.
(G) ChIP-qPCR of p53 at the p21 enhancer, promoter, and negative region. For primer locations, see Figure S1D.
(H) Distribution of speckle distances of p21 loci measured by immunoDNA-FISH.
(I) Distribution of speckle distances of p21 loci measured by immunoRNA-FISH.
(J) Number of p21 RNA molecules per cell as measured by RNA-FISH.
(K) Percentage of cells with active transcription sites as measured by RNA-FISH.
(L) Nascent RNA amount in p53 wild type and mutant Saos2 cells.
(M-P) Distance to speckle versus transcription site intensity in Saos2 cells induced to express wild type or Δ62–77 p53.
(Q) Model showing the consequences of perturbing specific p53 functions.
*** p < 0.0001, ** p < 0.01, * p < 0.05, unlabeled - not significant.
For additional characterization of p53 mutants, see Figure S4. For number of loci, transcription sites, and cells counted, see Table S1.

