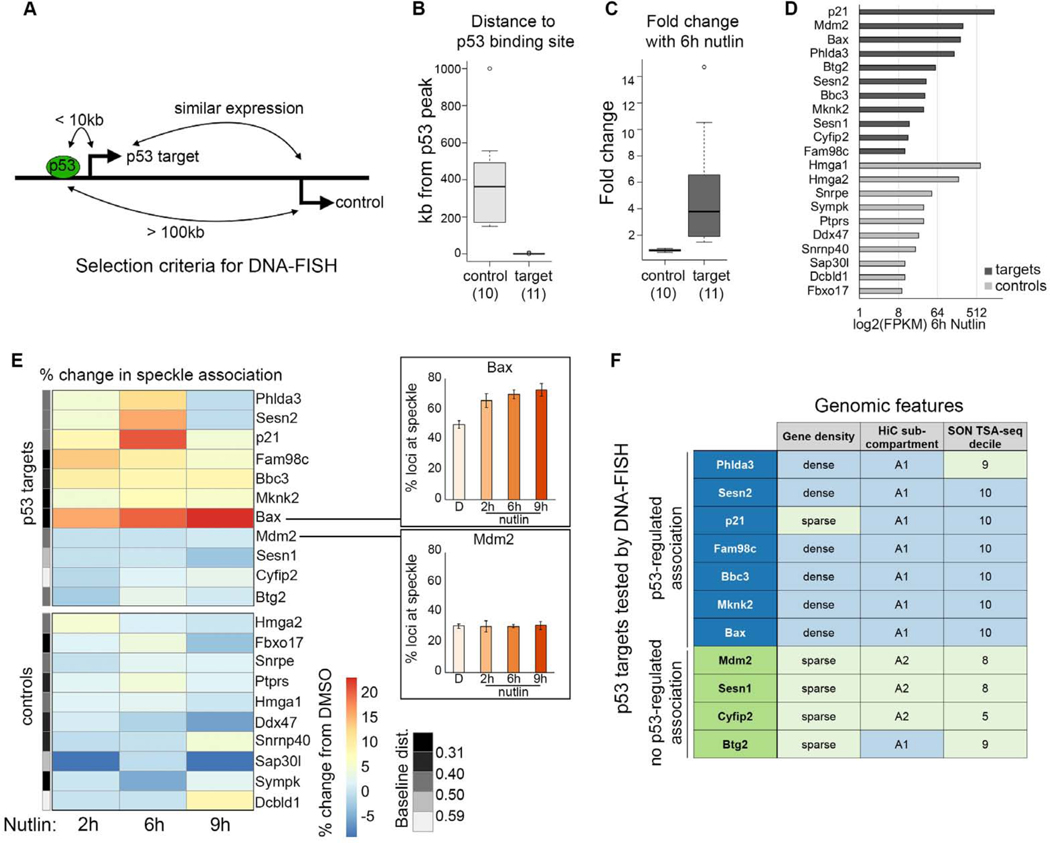
Figure 5. Nutlin-3a treatment drives increased speckle association of a subset of p53 targets.
(A) Schematic showing selection criteria for DNA-FISH control genes.
(B) Gene distance to the nearest p53 peak in IMR90 cells treated with Nutlin-3a (data from Sammons eta al., 2015).
(C) RNA fold change in IMR90 cells treated with Nutlin-3a (data from Sammons et al., 2015).
(D) Expression (FPKM) of control genes and p53 targets in IMR90 cells treated with Nutlin-3a.
(E) Heatmap of change in percentage of transcription sites with speckle association in IMR90 cells upon Nutlin-3a treatment relative to control. Plots (right) show examples of the primary data. The grey bar (left) shows the median baseline distance to the speckle, split into quintiles.
(F) Table of p53 target genes with (blue) or without (green) p53-regulated speckle association, and their gene density, HiC subcompartment, and SON TSA-seq decile.
For additional representations of speckle association, see Figure S5. For number of loci counted, see Table S1.

