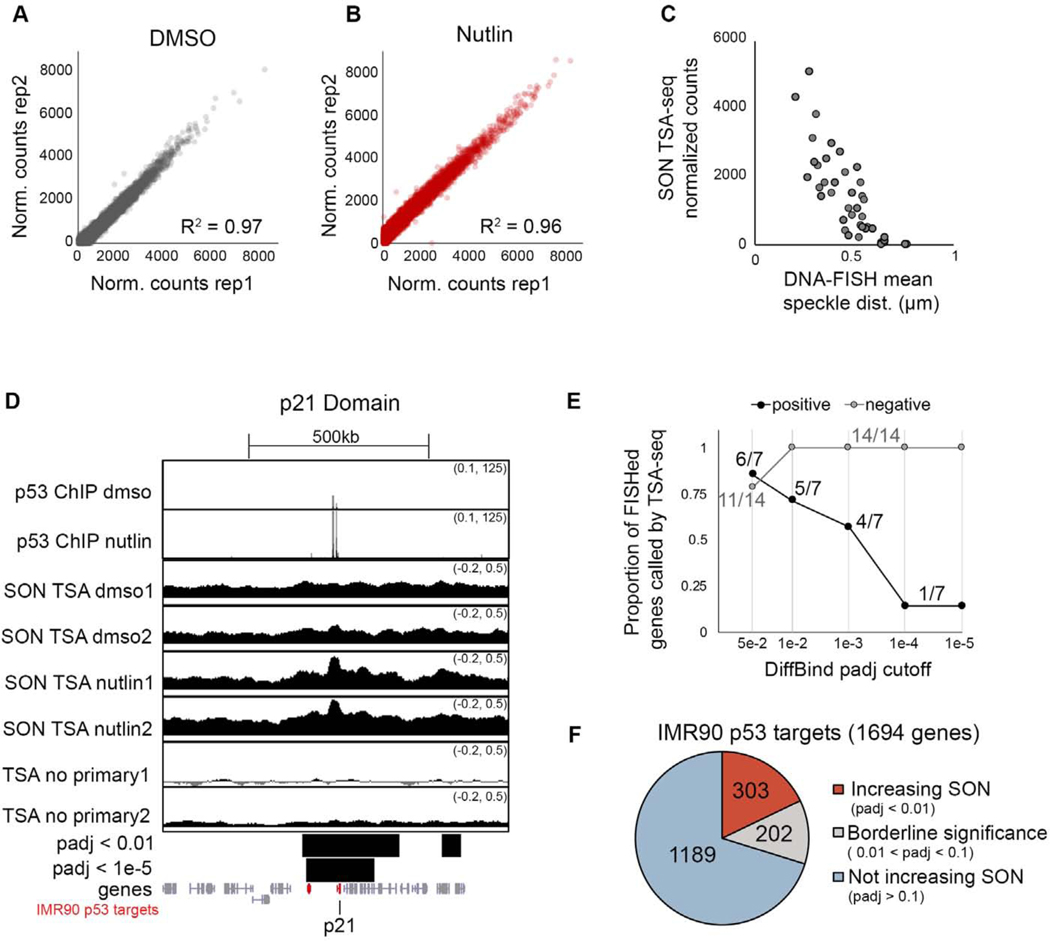
Figure 6. SON TSA-seq mapping of p53-induced changes in speckle association.
(A-B) Correlation of SON TSA-seq replicates quantified over 50kb windows.
(C) SON TSA-seq signal versus mean distance to speckle for 42 DNA-FISH measurements (same measurements as Figure S5).
(D) UCSC genome browser tracks of the p21 locus for p53 ChIP-seq (top) and SON TSA-seq in IMR90 cells treated with DMSO or Nutlin-3a for 6 hours, and no primary antibody control (smoothing of 10). Bars below show merged significant domains with adjusted p-value of 0.01 or 1e-5. Genes are in grey, with IMR90 p53 targets in red.
(E) Proportion DNA-FISHed genes that do (“positive”) or do not (“negative”) increase speckle association upon Nutlin-3a treatment that were correctly called by SON TSA-seq at different adjusted p-value cutoffs.
(F) Number of IMR90 p53 targets that increase SON signal (padj < 0.01; red), do not increase SON signal (padj > 0.1; blue), or have borderline significance (grey).
For additional quality checks on SON TSA-seq data, see Figure S6.

