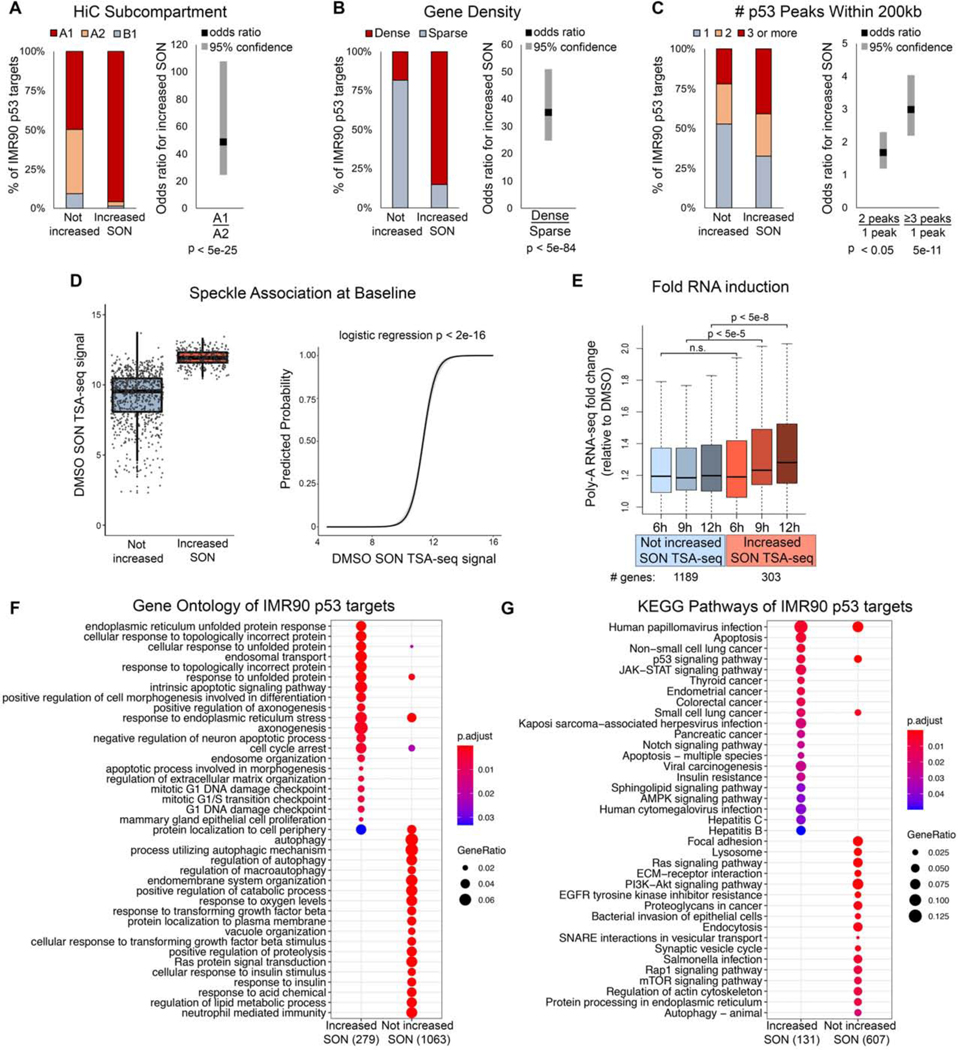
Figure 7. Characteristics of p53 targets that have p53-regulated increases in speckle association.
(A-C) Stacked barplots (left) and logistic regression odds ratios (right) of IMR90 p53 targets that do (Increased SON) or do not (Not increased) increase speckle association based on HiC subcompartments (A), gene density (B), and number of p53 peaks within 200kb (C).
(D) Baseline (DMSO) SON TSA-seq signal of p53 targets that do or do not increase speckle association (left), and logistic regression predicted probability that a p53 target increases speckle association based on baseline SON TSA-seq signal (right).
(E) Fold change (of Nutlin-3a for 6, 9, or 12 hours relative to DMSO) of p53 targets that increase (red) and do not increase (blue) SON signal.
(F-G) Gene ontology (F) and KEGG pathway (G) comparison of IMR90 p53 targets that do or do not increase SON TSA-seq signal upon Nutlin-3a treatment.

