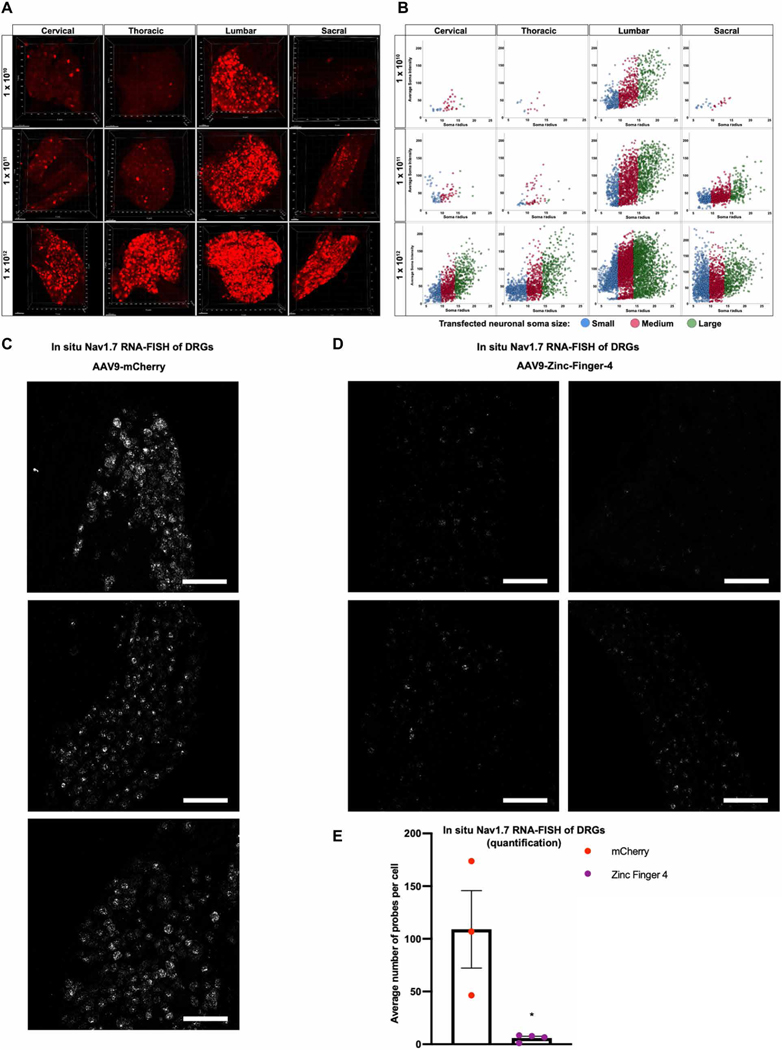
Fig. 2. Robust transduction of DRG via intrathecal delivery of AAVs.
(A) Representative three-dimensional maximum intensity projections from whole-mount DRGs along the neuraxis after intrathecal injections of AAV9-mCherry, illustrating distribution and transduction at different viral titers (1 × 10¹⁰, 1 × 10¹¹, or 1 × 10¹² vg per mouse). (B) Neuraxial distribution of small, medium, and large DRG neuronal soma as a function of their average soma fluorescent intensity (n = 4 mice per titer; cross-sectional area: small ≤ 300 μm2, medium = 300 to 700 μm2, large ≥ 700 μm2). (C and D) Representative 20× images of mice DRG transduced with 1 × 10¹² vg per mouse of AAV9-mCherry (C) or AAV9-Zinc-Finger-4-KRAB (D) labeled with RNAscope in situ hybridization for NaV1.7 (n = 3 for mCherry and n = 4 for Zinc-Finger-4-KRAB; scale bar, 50 μm). (E) Quantification of NaV1.7 expression in AAV9-mCherry or AAV9-Zinc-Finger-4-KRAB treatment conditions: Individual RNAscope probes and cells were identified in each respective image and used to calculate the average number of probes per cell (dots represent individual biological replicates; n = 3 for mCherry and n = 4 for Zinc-Finger-4-KRAB; error bars are SEM; Student’s t test, *P = 0.0205).

