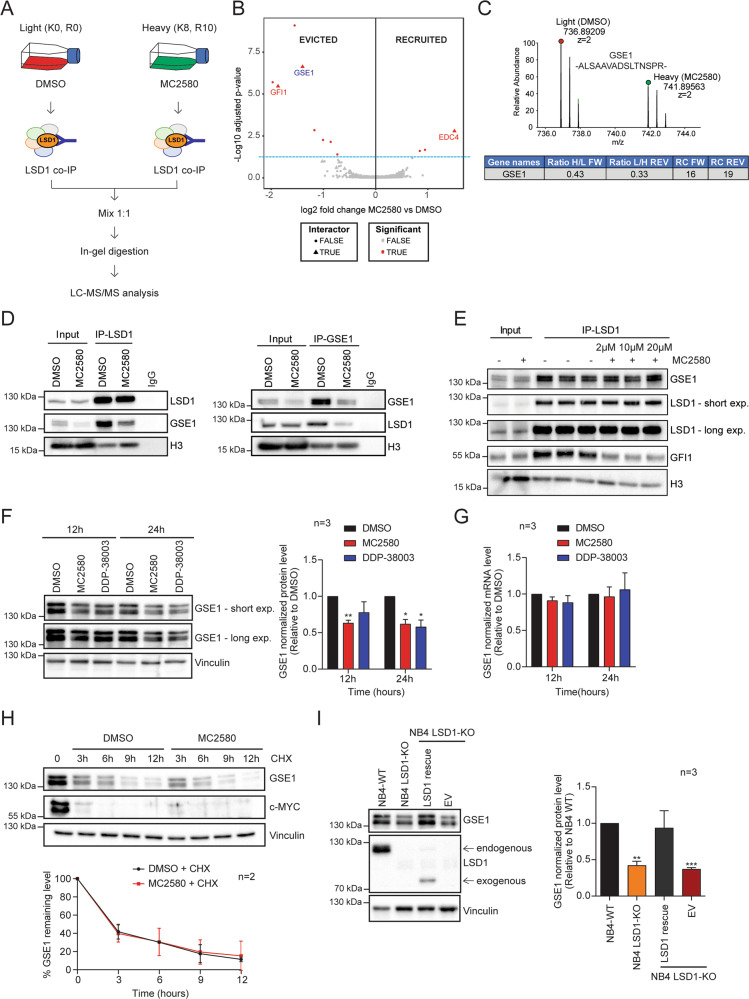
Fig. 1. LSD1 inhibitors alter LSD1–GSE1 interaction by reducing GSE1 protein levels in AML.
A Experimental design of the SILAC/LSD1 co-IP strategy setup to study the changes in LSD1 interactome upon 24 h treatment with 2 μΜ of MC2580, as described in ref. [13]. B Volcano plot displaying the alteration in the LSD1 interactome upon MC2580 treatment. Significantly evicted and recruited proteins are marked as red dots, while the proteins previously defined as specific LSD1 binders [13] are indicated by red triangles. The light-blue dashed line indicates the p-value threshold used to define the interactors modulated by the LSD1 inhibitors (p value < 0.05 calculated with limma [72]). Analysis of the evicted and recruited LSD1 interactors after pharmacological treatment is performed using the Differential Enrichment analysis of Proteomics data (DEP) R software package [40]. C Upper panel: MS1 spectrum of the SILAC peak doublet for the peptide 897-ALSAAVADSLTNSPR- 911 of GSE1 protein in the SILAC-LSD1 co-immuno-precipitated (co-IP) sample from NB4 cells treated for 24 h with 2 μΜ of MC2580 (heavy peak) and DMSO-treated control cells (light peak). Lower panel: Table displaying the H/L (forward replicate) and L/H (reverse replicate) ratios for GSE1 in SILAC-LSD1 co-IPs of NB4 cells treated with the compound MC2580 or DMSO. The table also shows the ratio count (RC) of each replicate, which corresponds to the number of peptides used for SILAC-based protein quantitation. The inhibitor was added to the heavy channel in the forward replicate and the light channel in the reverse one. D Western blot analysis of GSE1, LSD1, and H3 in LSD1 co-IPs (left panel) and GSE1 co-IPs (right panel), both in control and MC2580-treated cells (2 μΜ) for 24 h. Rabbit IgG was used as negative control co-IP. E Western blot analysis of GSE1, LSD1, GFI1, and H3 in in vitro LSD1 co-IPs using as input NB4 nuclear cell extract co-incubated for 6 h with increasing doses of MC2580 (2, 10 and 20 μM) and DMSO as control. F Left panel: Western blot analysis of GSE1 in NB4 cells treated with MC2580 (2 µM) DDP-38003 (2 µM) and control DMSO for 12 and 24 h. Vinculin was used as loading control. Right panel: Bar graph displaying the quantitation results of GSE1 protein, normalized over the Vinculin, in three independent replicates of NB4 cells treated with MC2580 (2 µM), DDP-38003 (2 µM), and DMSO. The results are plotted as fold change (FC) of GSE1 protein level in the treated samples over control (DMSO). The chart represents mean ± standard deviation (SD) (n = 3 biological replicates; one-sample T-test, **p value < 0.01, *p-value < 0.05). G RT-qPCR analysis on GSE1 transcript in NB4 cells treated for 12 and 24 h with MC2580 (2 µM), DDP-38003 (2 µM), and DMSO as control. GSE1 ct values are normalized against GAPDH. The results are plotted as FC of GSE1 mRNA levels in LSD1 inhibitors-treated conditions over DMSO. The chart represents mean ± SD of three (n = 3) biological replicates. Primer list in Table S7. H Upper panel: Representative Western blot analysis of GSE1 and c-MYC in NB4 cells treated with cycloheximide (0.1 mg/ml) in combination with MC2580 (2 µM) and DMSO as control for 3, 6, 9, and 12 h. Vinculin was used as loading control. Lower panel: Line-plot displaying the percentage of GSE1 protein level normalized over Vinculin in cycloheximide-treated NB4 cells, together with 2 µM of MC2580 or DMSO as control. The chart represents mean ± SD (n = 2 biological replicates). I Left panel: Western blot analysis of GSE1 and LSD1 in NB4 WT, NB4 LSD1-KO, and LSD1-KO cells transduced with either a retroviral empty PINCO vector (EV) or a PINCO vector containing an exogenous, N-terminal truncated (172–833) form of LSD1 [13]. Vinculin was used as loading control. Arrows indicate the endogenous and the exogenous LSD1. Right panel: Bar graph displaying quantitation of GSE1 protein level, normalized over Vinculin level in three replicates of NB4 WT, NB4 LSD1-KO, and LSD1-KO cells, transduced with either an empty PINCO vector (EV) or a PINCO vector containing an exogenous, N-terminal truncated (172–833) form of LSD1 [13]. In all samples, the data are plotted as FC of GSE1 protein level compared with the NB4 WT, with mean ± SD from n = 3 biological replicates (one-sample T-test, **p value < 0.01, ***p-value < 0.001).

