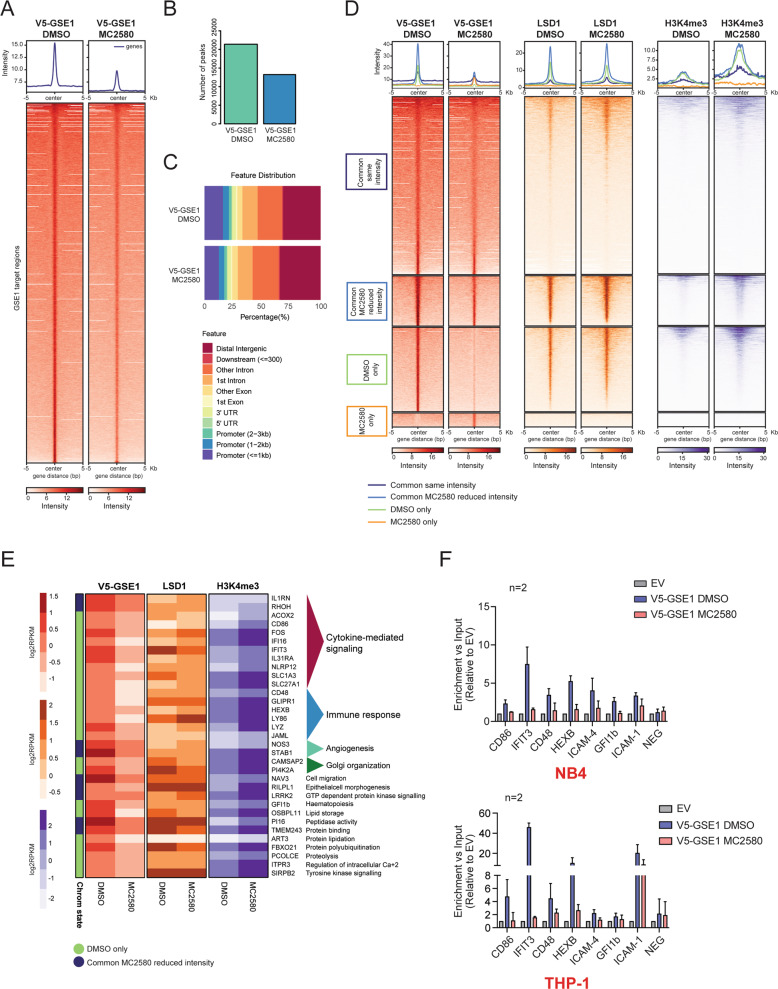
Fig. 4. MC2580 decreases GSE1 localization on the LSD1-bound promoters of genes involved in cytokine-mediated signaling and immune-response pathways.
A Heatmap representing the normalized V5-GSE1 ChIP-seq intensities ±5 kb around the center of the GSE1 target loci, at basal state and after 24 h of treatment with MC2580 (2 μM). V5-GSE1 ChIP-seq was performed in NB4 GSE1 OE cells produced by lentiviral transduction of the pLEX_307 construct containing the GSE1 coding sequence (NM_001134473.3) (pLEX_307 GSE1), while the negative control ChIP was carried out in cells transduced with the empty pLEX_307 (pLEX_307 EV). B Bar graph displaying the number of peaks extrapolated from the V5-GSE1 ChIP-seq in DMSO and MC2580-treated cells. C Genome annotation of the V5-GSE1 ChIP-seq peaks in control DMSO and LSD1-inhibited NB4 GSE1 OE cells. D Heatmap displaying the normalized V5-GSE1, LSD1, and H3K4me3 ChIP-seq intensities ±5 kb around the center of the GSE1 target loci after 24 h of treatment with MC2580 or DMSO as control. The heatmap is grouped in different subgroups, according to the presence or absence or differential intensity of the GSE1 binding regions in the two conditions. The subset of “Common GSE1 targets with reduced intensity in DMSO” contains only 32 regions and is not displayed in the figure. The LSD1 and H3K4me3 ChIP-seq data used to generate the heatmap were published in ref. [13]. E Heatmap displaying the V5-GSE1, LSD1, and H3K4me3 ChIP-seq intensities at the promoters of genes upregulated after LSD1 inhibition, which show reduced binding of V5-GSE1 in MC2580-treated cells. Each row in the heatmap represents an individual gene. For the V5-GSE1 ChIP-seq, read intensities in regions identified as peaks and annotated to each gene are plotted as log2 RPKM. Instead, for the LSD1 and H3K4me3 ChIP-seq, read coverage (log2 RPKM) at promoter (±2.5 kb distance from the TSS) was represented. For each gene, its chromatin state is shown as referred in Fig. 4D, F) V5-GSE1 ChIP-qPCR profiling of a panel of GSE1-bound promoters of genes significantly upregulated by LSD1 inhibition in DMSO and MC2580 (2 μM)-treated NB4 (upper panel) and THP-1 (lower panel) cells overexpressing GSE1 by pLEX_307 GSE1 construct transduction. V5 ChIP in cells transduced with the pLEX_307 EV was used as negative control ChIP. NEG indicates a negative control region. Data are normalized over the respective input and displayed as fold change (FC) over the control EV. Bar graph represents mean ±standard deviation (SD) from two (n = 2) biological replicates. Primers list in Table S7.

