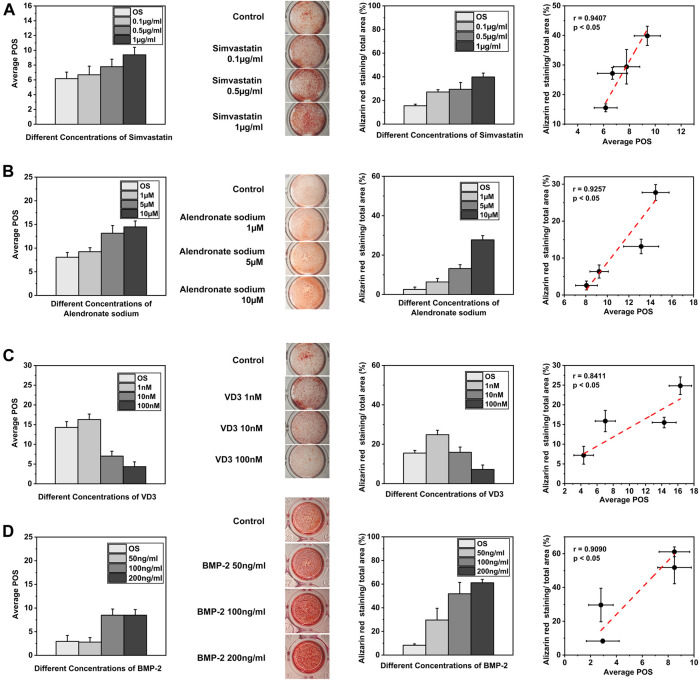
FIGURE 4.
OCNN for drug screening. (A) The predicted osteogenic score (POS) of the rBMSCs cultured with different concentrations of simvastatin on day 1 and Alizarin red staining on day 14 was quantified by ImageJ. Linear fits were performed using the POS and Alizarin red staining areas to calculate the correlation, p < 0.05. (B) The predicted osteogenic score (POS) of the rBMSCs cultured with different concentrations of alendronate sodium on day 1 and Alizarin red staining on day 14 was quantified by ImageJ. Linear fits were performed using the POS and Alizarin red staining areas to calculate the correlation, p<0.05. (C) The predicted osteogenic score (POS) of the rBMSCs cultured with different concentrations of VD3 on day 1 and Alizarin red staining on day 14 was quantified by ImageJ. Linear fits were performed using the POS and Alizarin red staining areas to calculate the correlation, p<0.05. (D) The predicted osteogenic score (POS) of the rBMSCs cultured with different concentrations of BMP-2 on day 1 and Alizarin red staining on day 14 was quantified by ImageJ. Linear fits were performed using the POS and Alizarin red staining areas to calculate the correlation, p<0.05.

