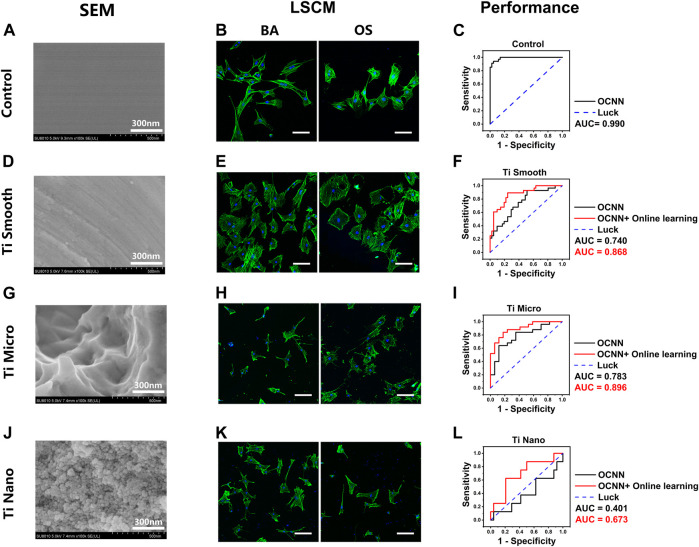
FIGURE 5.
OCNN prediction and OCNN-based online learning for rBMSCs on titanium surfaces. (A) (D) (G) (J) SEM images of control and three different titanium surfaces: smooth, micro, and nano, scale bar = 300 nm. (B) (E) (H) (K) LSCM images of the rBMSCs on control and three different titanium surfaces: smooth, micro, and nano. Basal medium (BA), osteogenic supplement medium (OS). Induction time: 24 h; green: F-actin; blue: nuclei. Scale bar, 100 µm. (C) (F) (I) (L) Comparison of OCNN prediction and OCNN-based online learning results using ROC curves. Black line: OCNN prediction; red line: OCNN accompanied with online learning.

