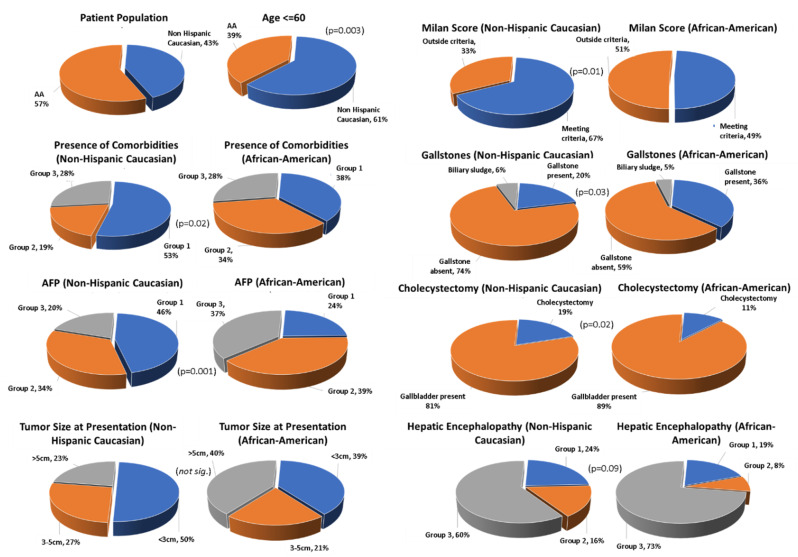
Figure 1.
Differences between Caucasian and African American (AA) populations and disease presentation in HCC. Graphical data are summarized from results Section 3. Shown are p-values or non-significance (not. sig.). Left panel: African American vs. Caucasian group representation, age, presence of co-morbidities, AFP values, and tumor size at presentation. Right panel: Milan score, presence of gallstones, cholecystectomy, and hepatic encephalopathy.

