FIGURE 1.

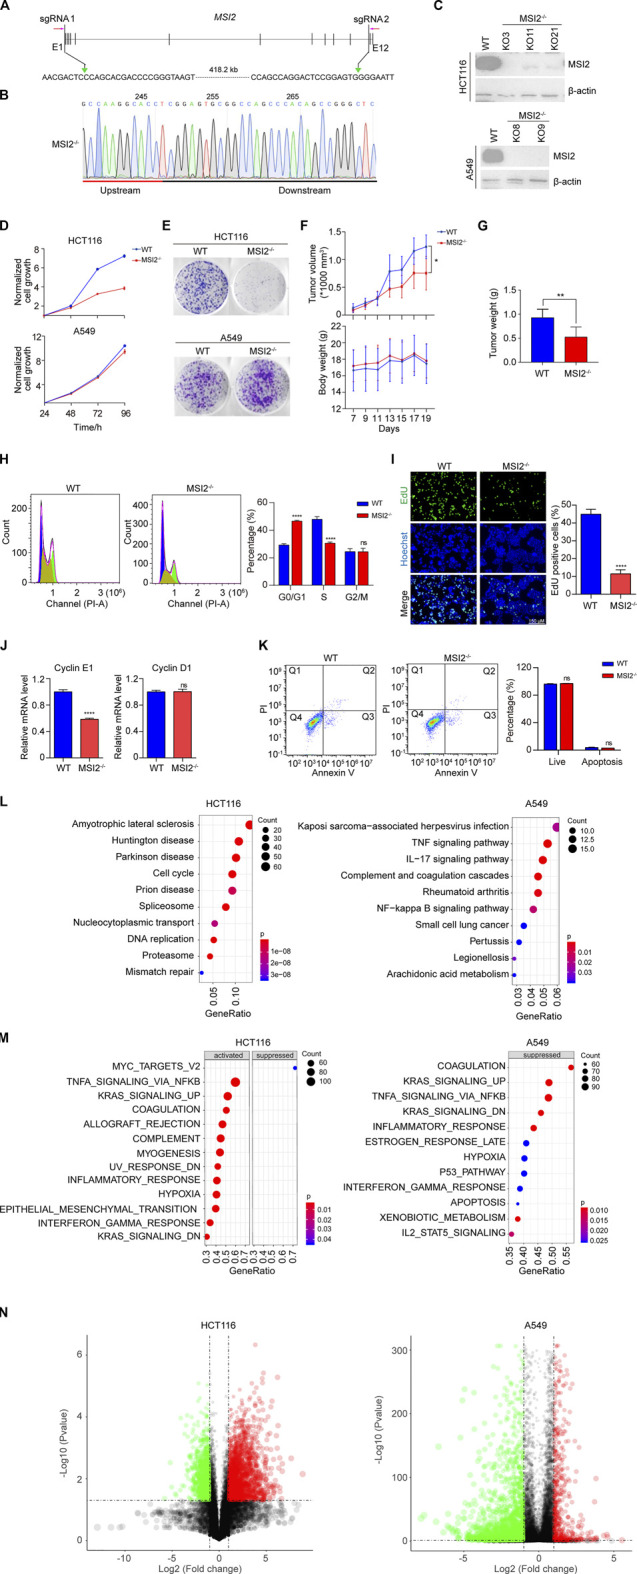
MSI2 is a potential therapeutic target of colon cancer. (A) Schematic depiction of CRISPR/Cas9-based genomic DNA deletion and PCR-based colony screening. Two sgRNAs were designed to target the coding sequence of MSI2. To screen MSI2-deleted colonies, one primer pair was designed, targeting the external deletion region (red arrows). (B) Genomic DNA sequencing confirmed the expected deletion at the sgRNA recognition sites in cancer cells containing GFP-tagged Cas9 and sgRNAs. (C) Immunoblotting analysis of MSI2 knockout HCT116 (KO3, KO11, and KO21) and A549 (KO8 and KO11) clones. (D) CCK8 assay of the viability of wild-type (WT) and MSI2 knockout (MSI2−/−) HCT116 and A549 cells cultured for the indicated time. Data of WT cells were indicated in blue, while the MSI2−/−’s were in red. Data were presented as mean ± SD of the three independent experiments. © Representative images of colony formation of WT and MSI2−/− HCT116 and A549 cells cultured for 8 days. (F) Growth curves of xenograft tumors and body weight of WT or MSI2−/− HCT116 xenograft nude mice. Data were presented as mean ± SD of six mice in each group, p < 0.05, two-way ANOVA. (G) Quantifications of MSI2 knockout HCT116 xenograft tumors’ weight. Data were presented as mean ± SD of six mice in each group, p < 0.01, unpaired t-test (two tailed). (H) Cell cycle assay was performed by staining of cells with propidium iodide (PI), followed by flow cytometry analysis. The scatter plots represented PI (X-axis) vs. counted cells (Y-axis). Cell cycle proportion was graphed at the right panel. (I) Fluorescent images and quantification of EdU incorporation in WT and MSI2−/− HCT116 cells. Scale bar: 150 μM. (J) Quantitative PCR analysis of the mRNA expression of Cyclin E1 and Cyclin D1 in WT and MSI2−/− HCT116 cells. (K) Representative scatter plots and quantification of apoptosis by Annexin V-FITC and PI staining in WT and MSI2−/− HCT116 cells. Q1 (Annexin V+, PI+): dead cells; Q2 (Annexin V−, PI+): late-stage apoptosis cells; Q3 (Annexin V+, PI−): early-stage apoptosis cells; Q4 (Annexin V−, PI−): live cells. Data were presented as mean ± SD of three independent experiments. p < 0.01, p < 0.001, p < 0.0001, ns: not significant, two-way ANOVA (H–K) and unpaired t-test (I,J). MSI2 is a potential therapeutic target of colon cancer. (L) Dot plotting of the top 10 pathways significantly enriched by downregulated genes in MSI2 knockout HCT116 and A549 cells. DEGs were identified as fold change (MSI2−/−/WT) <0.5 and alueaue <0.05, where the mRNA level of MSI2−/− cells were defined as the average of that in the three (KO3, KO11, and KO21) or two (KO8 and KO9) MSI2 knockout HCT116 or A549 cells, respectively. Y-axis represents pathways; X-axis represents the ratio of the MSI2-related mRNAs enriched in KEGG pathways. The color and size of each bubble represent enrichment significance and the number of MSI2-related mRNAs enriched in a pathway, respectively. (M) Global and unbiased gene expression pattern analysis (GSEA) of MSI2−/− cells using the hallmark gene set from MSigDB. The mRNA level of MSI2−/− cells was the average of three (KO3, KO11, and KO21) or two (KO8 and KO9) MSI2 knockout HCT116 or A549 cells, respectively. Y-axis represents hallmark biological states or processes. X-axis represents the enriched genes’ ratio in the specific hallmark pathways. The color and size of each bubble represent enrichment significance and gene numbers enriched in hallmark pathways, respectively. (N) Volcano plots depicting the differential genes expression between wild-type and MSI2−/− cells. Red dot represents significantly upregulated mRNA (log2 fold change >1, p-value < 0.05), Green dot represents significantly downregulated metabolite (log2 fold change ≤1, p-value < 0.05). Fold change is calculated as MSI2−/−/WT.
