Figure 1.
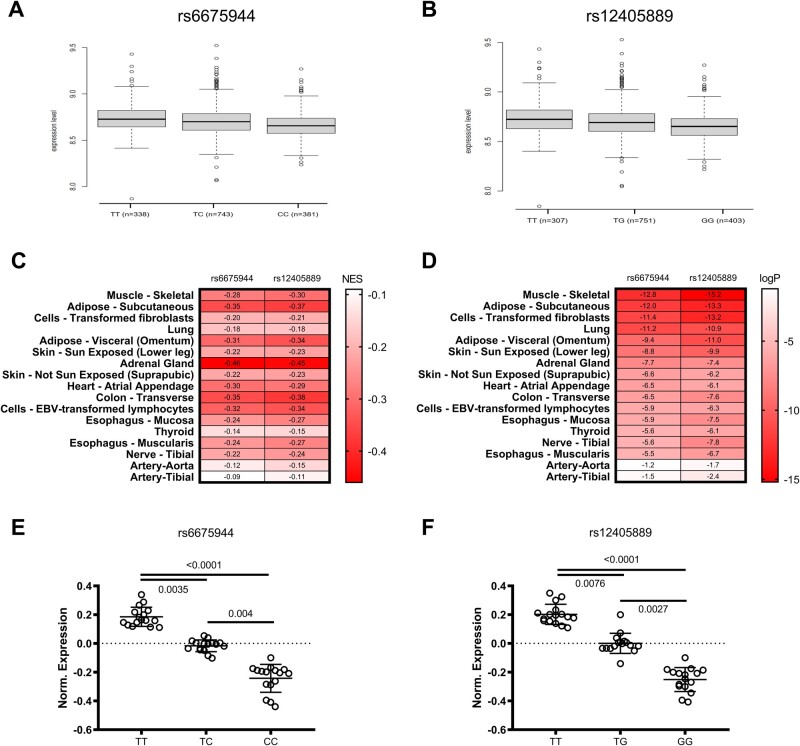
Association of the SNPs rs6675944 and rs12405889 in population studies and TBCE expression data in pooled tissue analyses. (A). Expression level of TBCE gene in the presence of rs6675944 SNP and (B). rs12405889 in peripheral blood mononuclear cells of the enrolled individuals (mean±SD). (C). Normalized Effect Size (NES) heatmap of rs6675944 and rs12405889 SNPs in various human tissues. (D). LogP value heatmap of rs6675944 and rs12405889 SNPs in various human tissues. (E and F) Normalized expression of TBCE in the presence of SNP rs6675944 and SNP rs12405889, stratified by genotype. Pooled data from tested human tissues. (One-Way ANOVA, Tukey’s comparison Test, Kruskal-Wallis, Dunn’s multiple comparison test).

