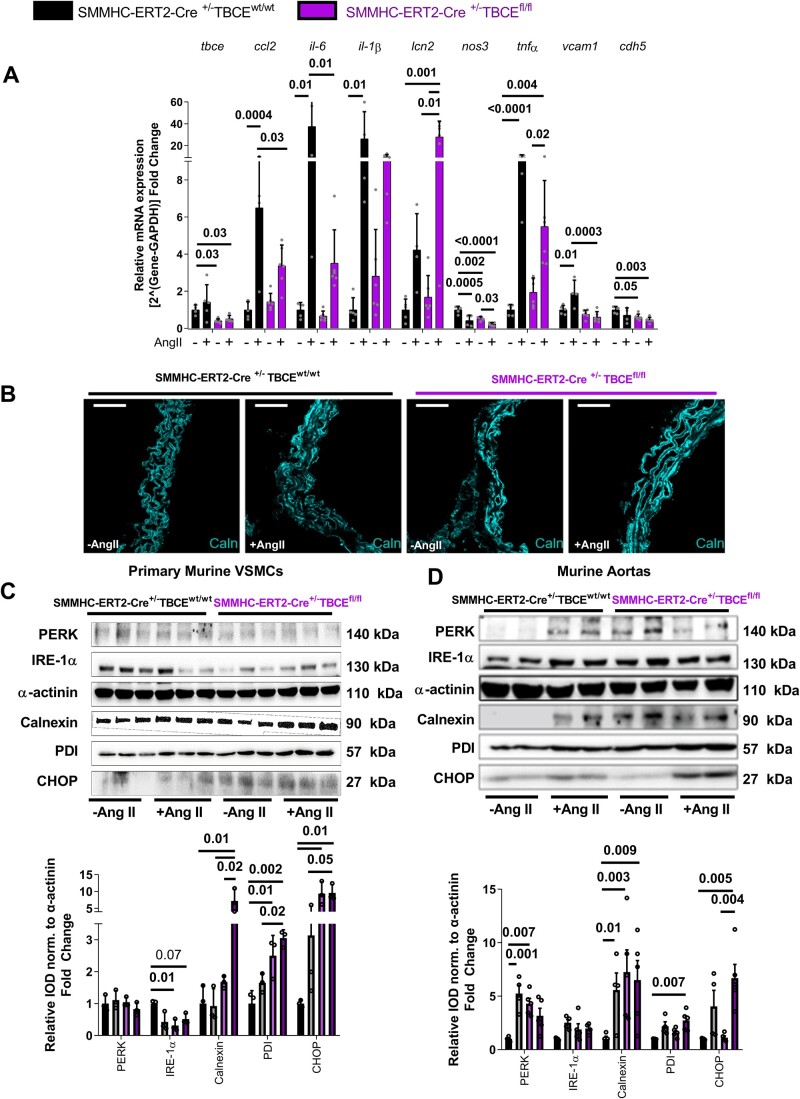
Figure 3.
Pivotal role of ER stress for the vascular phenotype of SMMHC-ERT2-Cre+/−TBCEfl/fl mice. (A) RT-PCR data of mRNA expression of the differentially regulated genes from the murine aortas (n = 5–6 per group). (B) Immunofluorescent images of SMMHC-ERT2-Cre+/−TBCEfl/fl aortas stained against DAPI (blue) and Calnexin (cyan) (64 × magnification, white bar represents 20 µm). Protein expression analysis of ER stress markers in vascular smooth muscle cells (C, n = 3 per group) and murine aortas (D, n = 4–5 per group). Top: Representative Western blot images; Bottom: Relative densitometry analysis of proteins normalized to α-actinin. Tukey’s multiple comparison test; One-way ANOVA.

