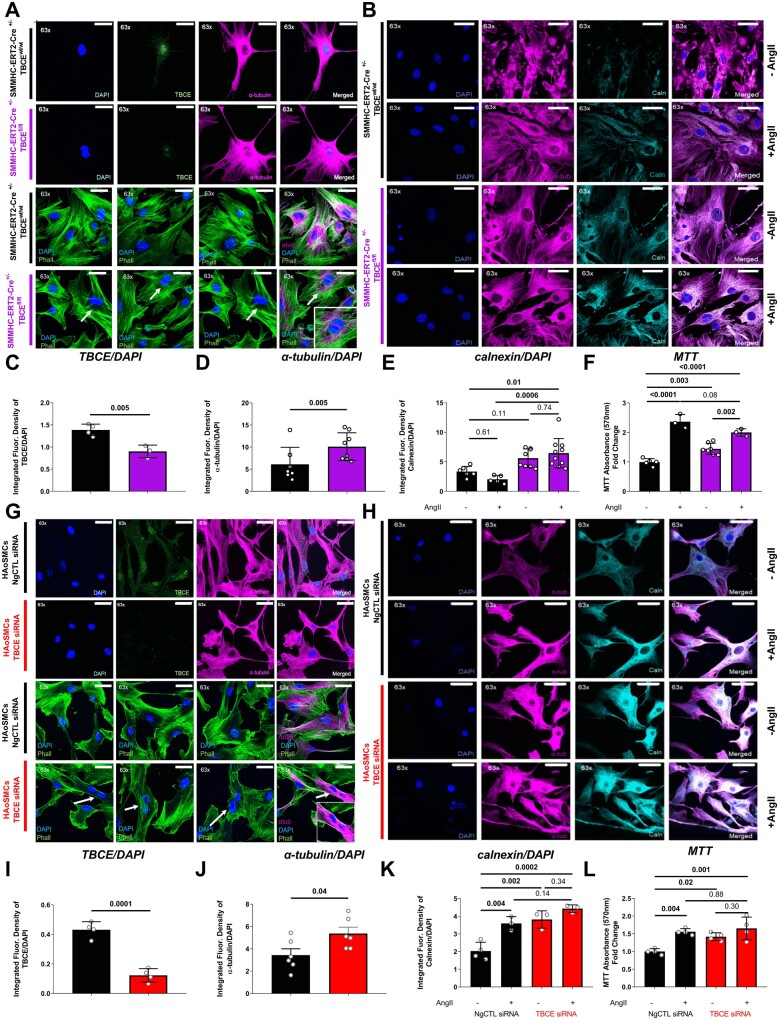
Figure 4.
TBCE knockdown led to a proliferating phenotype in both primary murine VSMCs and in TBCE-silenced HAoSMCs. Confirmation of ER stress induction in vitro. Representative immunofluorescence images of (A) primary VSMCs isolated from murine aortas, stained for DAPI (blue), TBCE (green) and α-tubulin (magenta) (upper panel) or phalloidin (green, F-actin; n = 3 representative images per group), α-tubulin (magenta) and DAPI (blue) (lower panel) as cellular morphology markers; and (B) primary VSMCs isolated from murine aortas (±AngII treatment) were stained for DAPI (blue), α-tubulin (magenta) and calnexin (cyan). Graphs of integrated fluorescence intensity of (C) TBCE/DAPI (n = 3–4 per group) (D) α-tubulin/DAPI (n = 7–8 per group) (E) Calnexin/DAPI (n = 5–9 per group) (F) MTT proliferation assay of primary VSMCs (±AngII treatment) (n = 3–7 per group). Representative immunofluorescence images of (G) human aortic VSMCs (HAoSMCs) transfected with negative control siRNA (NgCTL) or with TBCE siRNA stained for DAPI (blue), TBCE (green), and α-tubulin (magenta) (upper panel) or phalloidin (green, F-actin; n = 3 representative images per group), α-tubulin (magenta) and DAPI (blue) (lower panel) as cellular morphology markers; and of (H) transfected HAoSMCs (± AngII treatment) stained for DAPI (blue), α-tubulin (magenta), and calnexin (cyan). Graphs of integrated fluorescence intensity of (I) TBCE/DAPI (n = 4 per group) (J) α-tubulin/DAPI (n = 6 per group) (K) Calnexin/DAPI (n = 4–3 per group) (L) MTT proliferation assay of primary VSMCs (±AngII treatment) (n = 4 per group) (Tukey’s multiple comparison test; one-way ANOVA; different numbers in the in vitro experiments refer to individual experiments).

