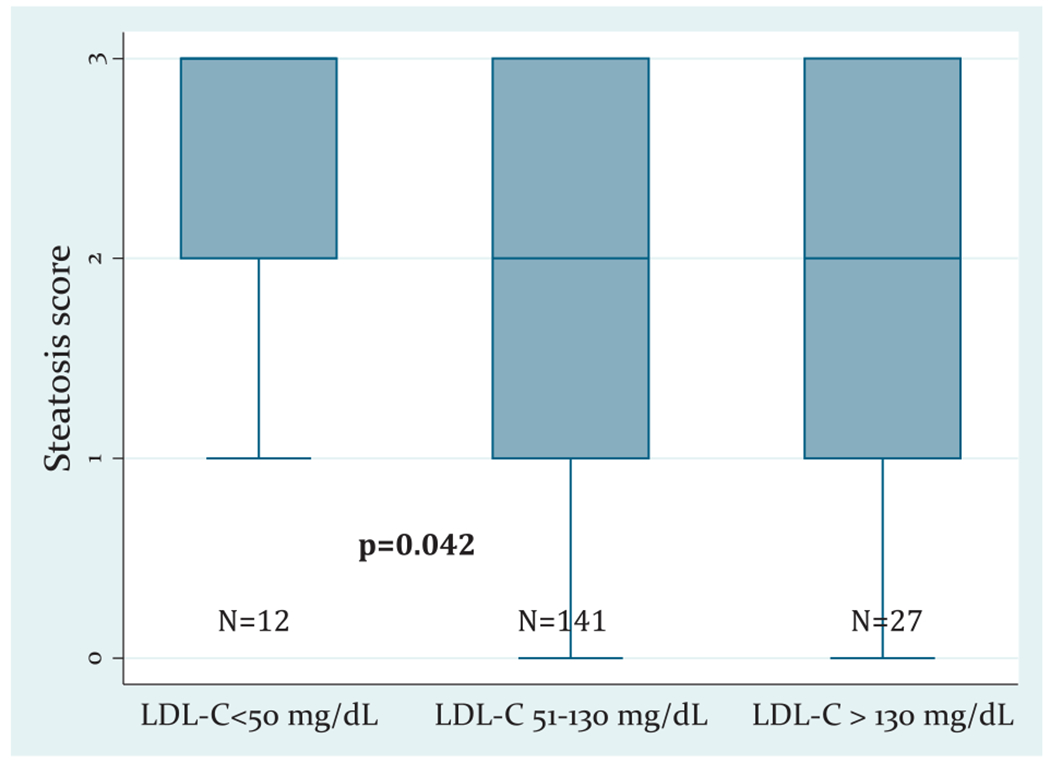
Figure 1.

Differences in the steatosis score of nonhypertriglyceridemic patients grouped by LDL-C levels. The boxplots depict the median value (thick line inside the box), the first and third quartiles (lower and upper limit of the box), and the range (tip of lines) of the steatosis score.
