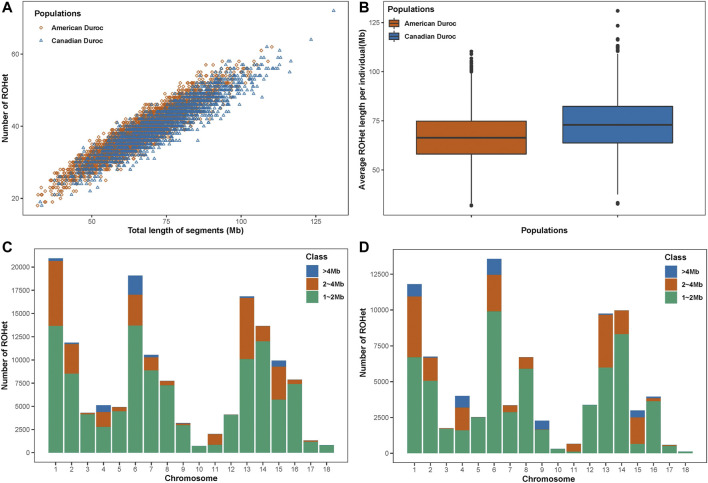
FIGURE 1.
ROHet statistics in two Duroc populations. (A) Number and total length of ROHet per individual for two Duroc populations. (B) Average ROHet length per individual for two Duroc populations. (C) Number of total ROHet and number of ROHet classes per chromosome for the S21 population. (D) Number of total ROHet and number of ROHet classes per chromosome for the S22 population.

