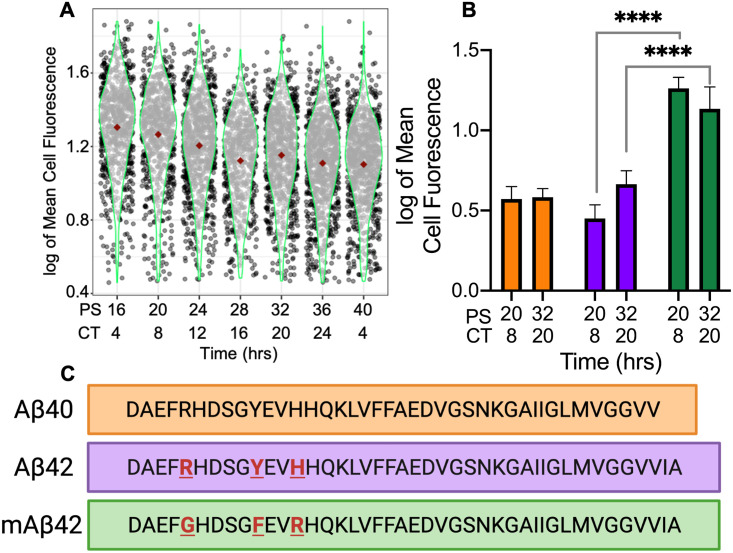
Fig 6. HSPG-regulated circadian macrophage phagocytosis was contingent upon HSPG-Aβ binding and aggregation.
(A) Violin plot of mAβ42 phagocytosis represented in logged mean cell fluorescence values plotted against PS and CT. Grey dots represent a single cell measurement, green violin plot lines represent the range of the data, and red diamonds indicate the mean measurement of each time point. (B) A bar chart comparing Aβ40 phagocytosis (orange) to Aβ42 phagocytosis (purple) and mAβ42 phagocytosis (green) at PS20/CT8 and PS32/CT20. All data shown was performed in triplicate and the error bars represent the standard deviation of the replicates. **** = p<2.2 x 10⁻¹⁶ and Hedge’s g>2.0 (C) An amino acid sequence comparison to show the differences between the Aβ42, Aβ40, and mAβ42 sequences.

