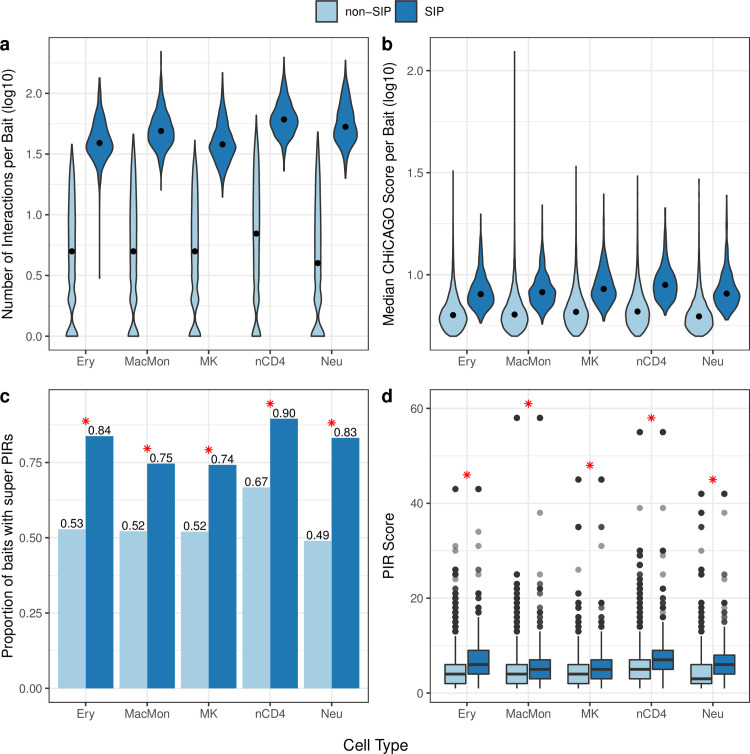
Fig 2. SIPs are driven by a large number of interactions.
(A) Distribution of the number of significant interactions (log10 scale) between promoter bait and promoter interacting regions (PIRs) for SIPs and non-SIPs in each cell type. (B) Distribution of the median CHiCAGO score (log10 scale) of significant interactions per promoter bait for SIPs and non-SIPs in each cell type. The width of each violin corresponds to the frequency of interaction count (A) or median CHiCAGO score (B). The median of each distribution is marked by a black dot. (C) The proportion of SIP and non-SIP baits with super PIRs in each cell type. SIPs interact with a larger proportion of super PIRs than non-SIPs in each cell type (the red asterisk (*) denotes Chi-square p-value < 3.2e-35). (D) Distribution of PIR scores for SIPs and non-SIPs in each cell type. SIPs have significantly higher PIR scores than non-SIPs in each cell type (the red asterisk (*) denotes Wilcoxon p-value < 1.7e-50). Details for panels (C) and (D) can be found in S1 Table. (Ery = erythrocytes; MacMon = macrophages/monocytes; MK = megakaryocytes; nCD4 = naive CD4 T-cells; Neu = neutrophils).

