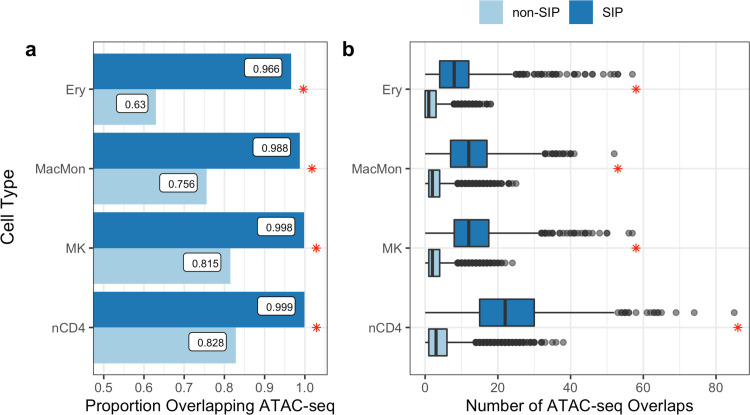
Fig 3. SIP PIRs overlap with ATAC-seq peaks.
(A) In each cell type, the proportion of SIP having at least one PIR that overlaps a cell type-specific ATAC-seq peak is significantly greater than the proportion of non-SIP having at least one PIR that overlaps an ATAC-seq peak (the red asterisk (*) denotes Chi-square p-value < 2.2e-16). (B) The distribution of the number of PIRs overlapping with ATAC-seq peaks for each pcHi-C bait (y-axis) for each cell type (x-axis). In each cell type, significantly more SIP interactions overlap with ATAC-seq peaks compared to non-SIP interactions (the red asterisk (*) denotes two-sided t-test p-value < 1.2e-162). (Ery = erythrocytes; MacMon = macrophages/monocytes; MK = megakaryocytes; nCD4 = naive CD4 T-cells; Neu = neutrophils).

