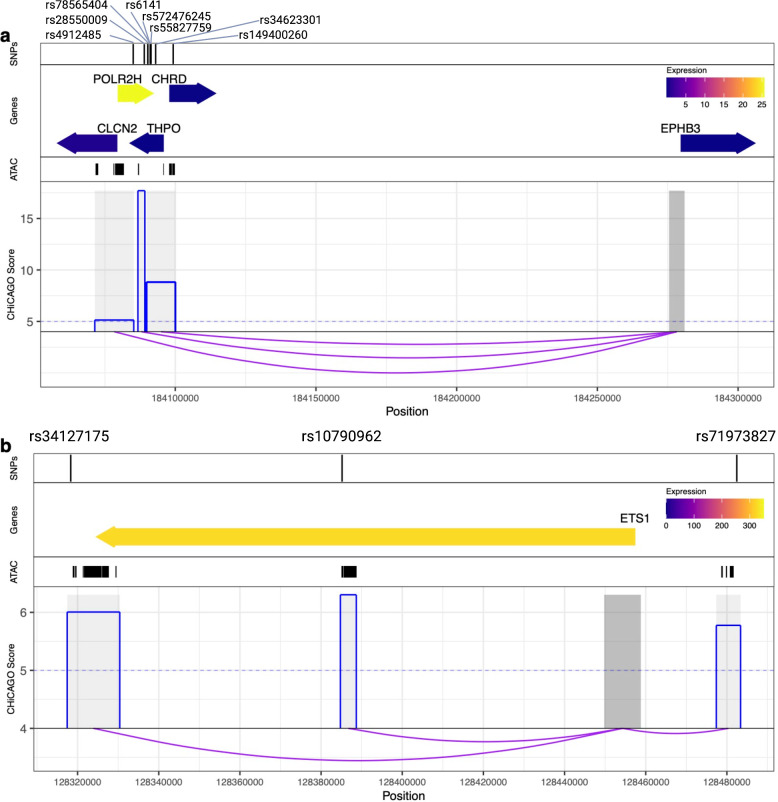
Fig 4. SIP subnetworks show the complex regulation of promoters for important hematopoietic cell type genes.
First panel: position of SNPs. Second panel: position of SIP bait or PIR target gene(s), where the color corresponds to their exponentiated BLUEPRINT gene expression (equivalent to RPKM) in the respective cell type. Third panel: cell type-specific ATAC-seq peaks. Fourth panel: CHiCAGO scores (blue) of the interactions (depicted by purple arcs) between the SIP bait (dark grey) and the SIP PIRs (light grey). (A) Example of a megakaryocyte SIP subnetwork for platelet count related variants. (B) Example of a naive CD4 T-cell SIP subnetwork for lymphocyte count related variants.

