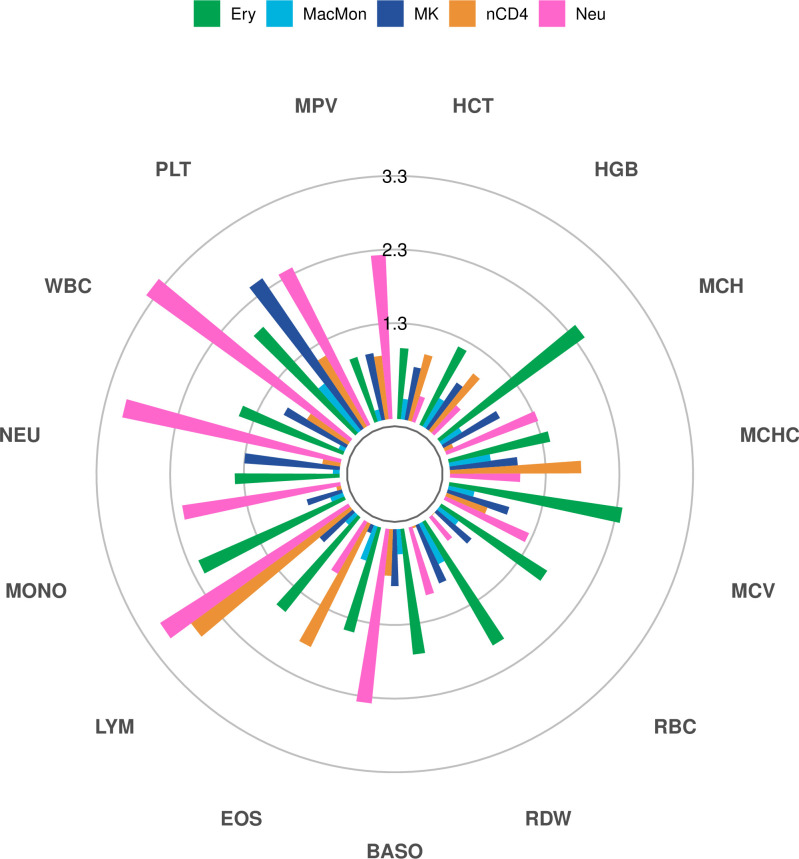
Fig 5. Partitioned heritability for blood cell traits shows enrichment between PIRs of cell type-specific SIPs and relevant traits.
Enrichment score p-values (-log10 scale) for PIRs of cell type-specific SIPs and 15 blood cell traits. Bars passing the inner ring (1.3) correspond to statistically significant enrichment scores (p-value < 0.05). See S5 Fig for enrichment scores. (Cell types: Ery = erythrocytes; MacMon = macrophages/monocytes; MK = megakaryocytes; nCD4 = naive CD4 T-cells; Neu = neutrophils. Blood cell traits: HCT = Hematocrit; HGB = Hemoglobin; MCH = Mean Corpuscular Hemoglobin; MCHC = MCH Concentration; MCV = Mean Corpuscular Volume; RBC = Red Blood Cell Count; RDW = RBC Distribution Width; BASO = Basophil Count; EOS = Eosinophil Count; LYM = Lymphocyte Count; MONO = Monocyte Count; NEU = Neutrophil Count; WBC = White Blood Cell Count; PLT = Platelet Count; MPV = Mean Platelet Volume).

