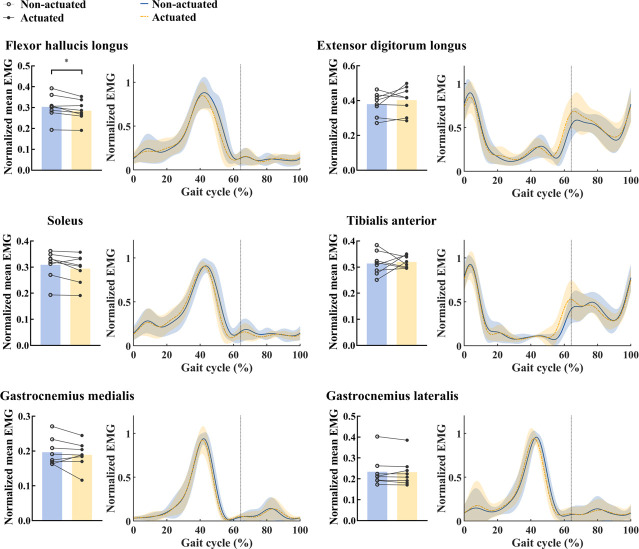
Fig 6. Muscle activities of six muscles over the one gait cycle.
Normalized mean EMG (left) and normalized EMG over one gait cycle (right) under actuated and non-actuated conditions are shown for each muscle. Lines link data points from same participant. Curves are averages taken over all participants; shaded regions indicate one standard deviation. The vertical lines indicate the toe-off.

