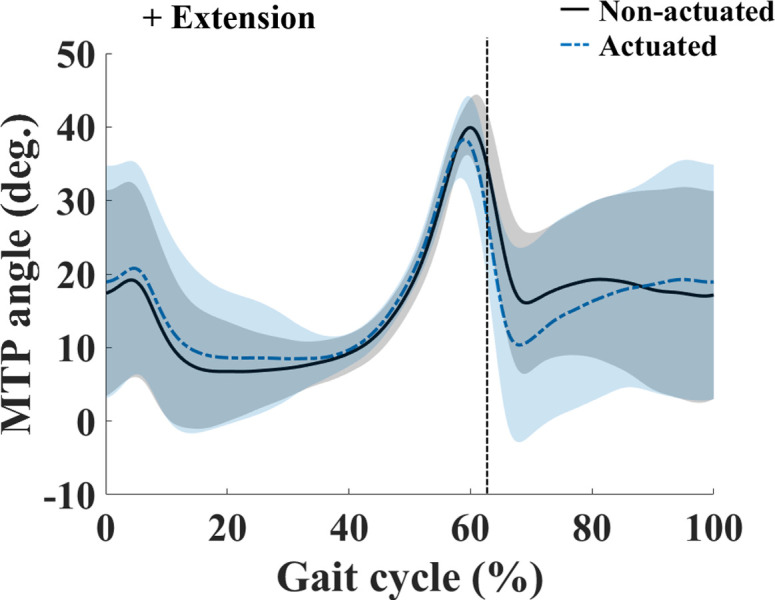
Fig 7. MTP angle over one gait cycle.

Curves are averages taken over all participants; shaded regions indicate one standard deviation. The vertical lines indicate the toe-off.

Curves are averages taken over all participants; shaded regions indicate one standard deviation. The vertical lines indicate the toe-off.