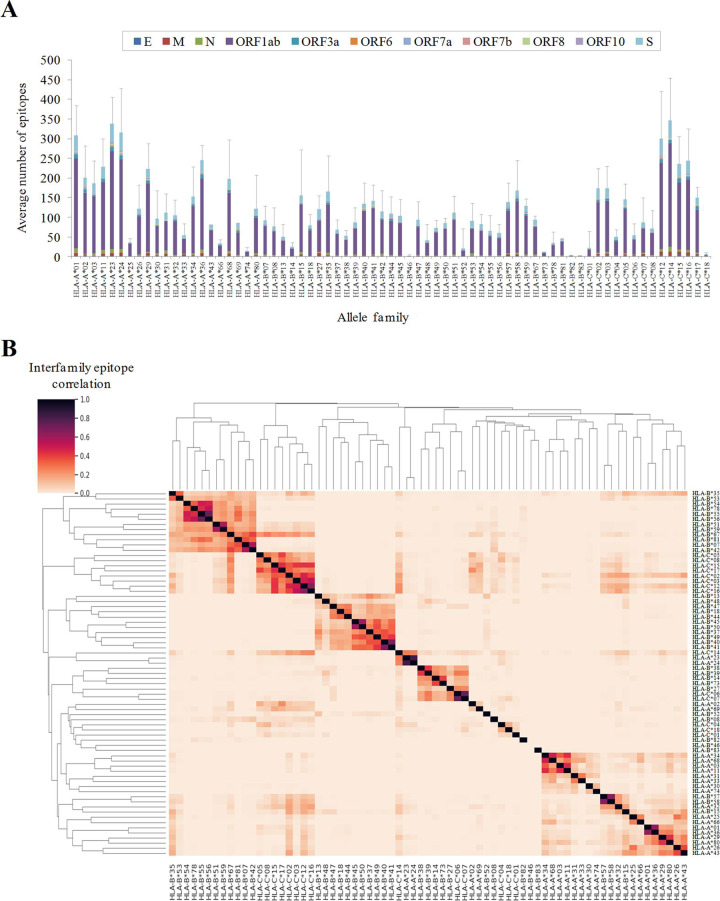
Fig 2. Number and degree of overlap between SARS-CoV-2 epitopes for different HLA-class I allelic families.
(A) Average number of predicted HLA class I epitopes by allele family and protein. The standard deviation resulting from all proteins is indicated as a single error bar. (B) Hierarchical clustering and associated heatmap indicating the degree of inter-family epitope correlation. Color intensity expresses the Jaccard index for the epitope intersection between all family pairs. Perfect location match between epitopes calculated by netMHCIpan 4.1 EL with score ≥ 0.5 and rank ≤ 0.5 were utilized to calculate intersection and union. Intra-family conserved epitopes (≥ 50% alleles in the family by exact match) are in S1 Table.

