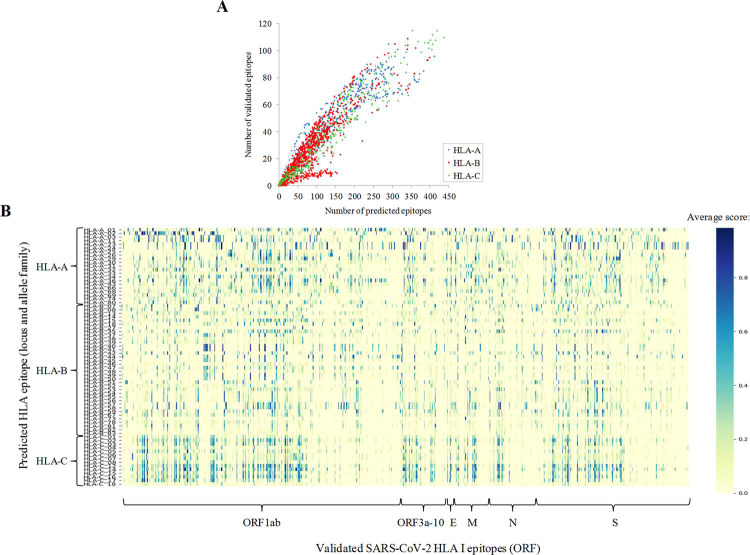
Fig 3. Comparison between predicted and validated epitopes.
(A) Number of predicted epitopes (score ≥ 0.5 and rank ≤ 0.5) versus validated epitopes per allele. (B) Heatmap showing the family average score (any score, rank ≤ 2) for validated HLA class I epitopes. Predicted epitopes with perfect matches with validated epitopes stored in the IEDB are indicated in S1 Table.

