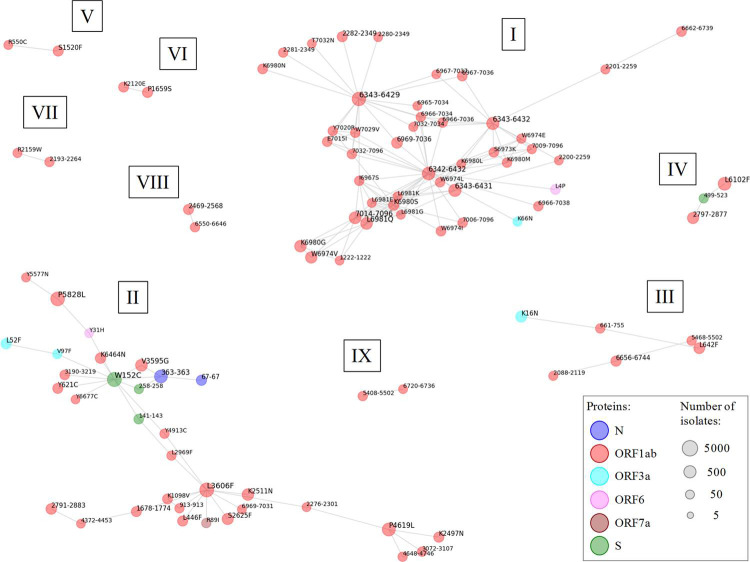
Fig 7. Networks of coupled supermotif escape mutations.
Undirected unweighted graphs showing coupled supermotif escape mutations. Sub-networks are named with roman numbers. Nodes correspond to mutations that were substitutions (position and residue change) or deletions (residue range). No coupled insertions were detected. The node color indicates the antigen protein. The sphere diameter reflects the amount of isolates harboring the mutation. Nodes represent mutations carried by ≥ 25 isolates. Edges represent co-existence of a mutation pair in ≥ 20% isolates of all those carrying at least one of the mutations.

