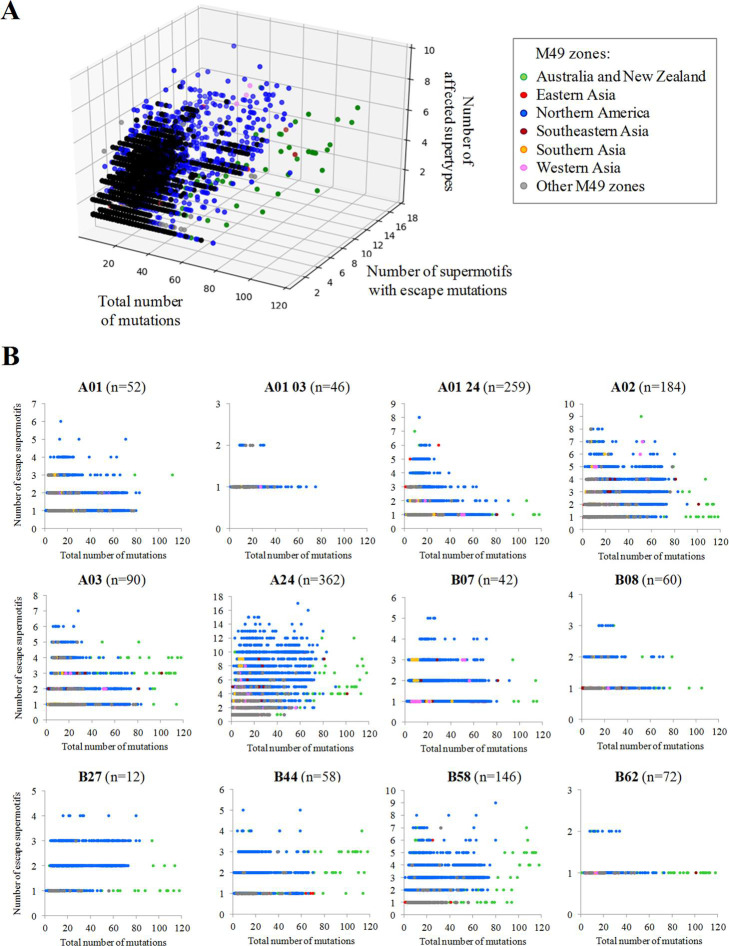
Fig 8. Isolates carrying different combinations of escape mutations.
(A) Each point represents an isolate plotted according to the total number of mutations, the number of escape supermotifs and number of affected supertypes. Only isolates harboring three or more escape supermotifs are represented. (B) Chart panel indicating mutated isolates according to the number of escape supermotifs for each supertype. Isolates are colored by M49 zone of collection.

