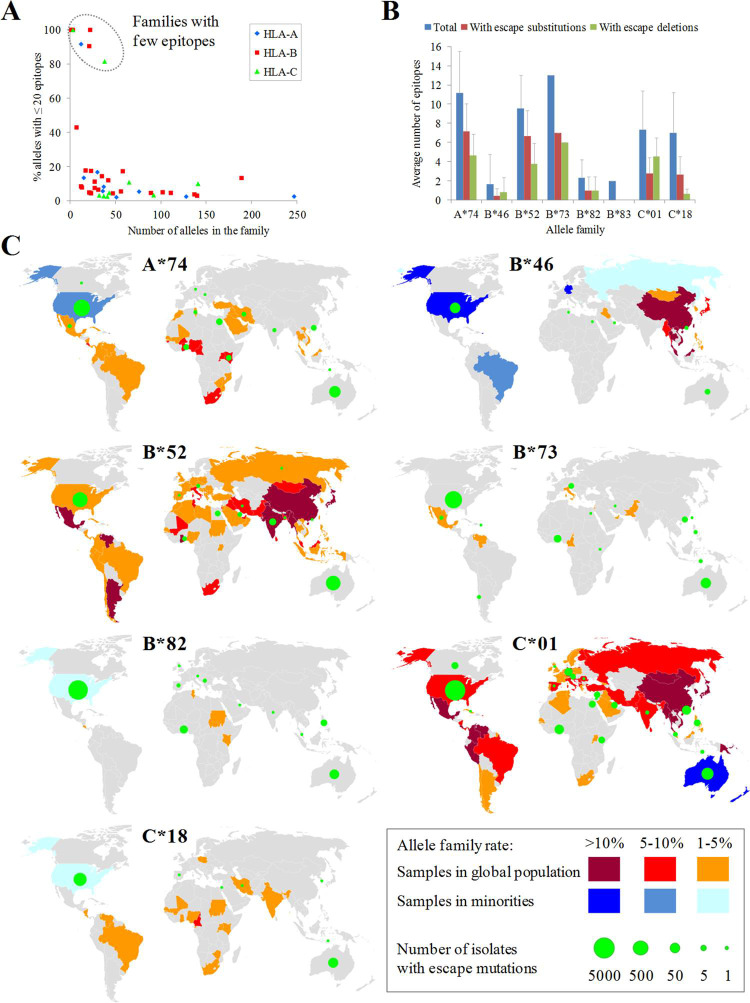
Fig 9. Escape mutations in allele families with fewest epitopes.
(A) Number of alleles with ≤ 20 epitopes versus the total number of alleles for HLA families of the three loci. Families without any allele with ≤ 20 epitopes are not represented. (B) Average number of escape epitopes, either by substitutions or deletions, respect to the average total number of epitopes for the eight allele families with the fewest epitopes. (C) World map panel indicating the presence of population samples carrying alleles of the eight families with fewest epitopes and isolates with escape mutations for these families. Family allele frequencies are color ranked for both the majority population (red scale) and sub-population (blue scale) samples. Only the highest frequency sample per country was considered. A B*83 map is not shown due to the extremely low prevalence of this allele family. Spheres in green indicate the presence of isolates with escape mutations for the allele family collected in that country. The sphere diameter is proportional to the total number of these isolates. Epitope escape substitutions and deletions for the eight allele family with fewest epitopes are listed on S6 and S7 Tables, respectively. The base layer for the world map was downloaded from https://naturalearthdata.com/downloads/50-m-cultural-vectors/50m-admin-0-details/.

