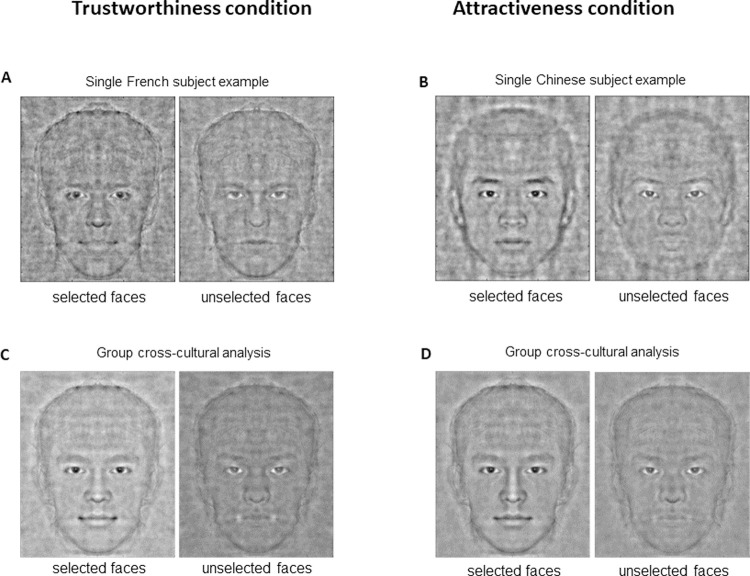
Fig 2. Classification images.
Classification images were obtained by averaging the noise patterns selected by the subject and by adding or removing the obtained averaged noise from the original face stimulus. By doing so, the consistently modulated face parts were highlighted. A and B–Single subject classification images. (A) Example of a single subject classification image (signal/noise ratio = 1) of one French participant for a judgment of trust on the European descent stimulus. (B) Example of a single subject classification image (signal/noise ratio = 1) of one Chinese participant for a judgment of attractiveness on Asian faces. For each participant, the reverse correlation task reveals a picture with important modulations of the facial cues and the face structures of the baseline stimulus, revealing an image of each subject’s internal representation linked to their judgment. C and D–Mean classification images. (C) Grand average of all 160 classification images (European and Asian descent faces) obtained from the all 80 participants (French and Chinese) who made trustworthiness judgments (signal/noise ratio = 1/3). (D) Grand average of all 160 classification images (European and Asian descent faces) obtained from all 80 participants (French and Chinese) who made an attractiveness judgment (signal/noise ratio = 1/3). By doing so, pixels that are consistently modulated at the population level are highlighted while subject-specific and culture-specific modulations are averaged out.

