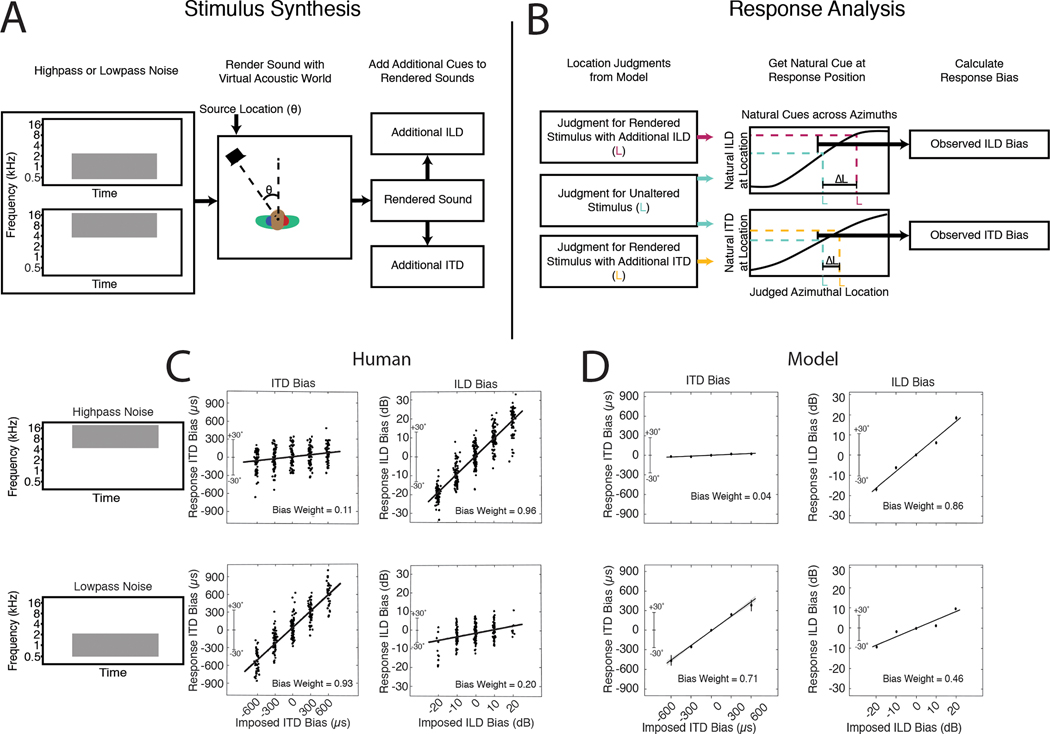
Figure 2.
Sensitivity to interaural time and level differences. A. Schematic of stimulus generation. Noise bursts filtered into high or low frequency bands were rendered at a particular azimuthal position, after which an additional ITD or ILD was added to the stereo audio signal. B. Schematic of response analysis. Responses were analyzed to determine the amount by which the perceived location (L) was altered (ΔL) by the additional ITD/ILD, expressed as the amount by which the ITD/ILD would have changed if the actual sound’s location changed by ΔL. C. Effect of additional ITD and ILD on human localization. Y axis plots amount by which the perceived location was altered, expressed in ITD/ILD as described above. Each dot plots a localization judgment from one trial. Data reproduced from a previous publication69. D. Effect of additional ITD and ILD on model localization. Same conventions as B. Error bars plot SEM, bootstrapped across the 10 networks.

