Figure 5.
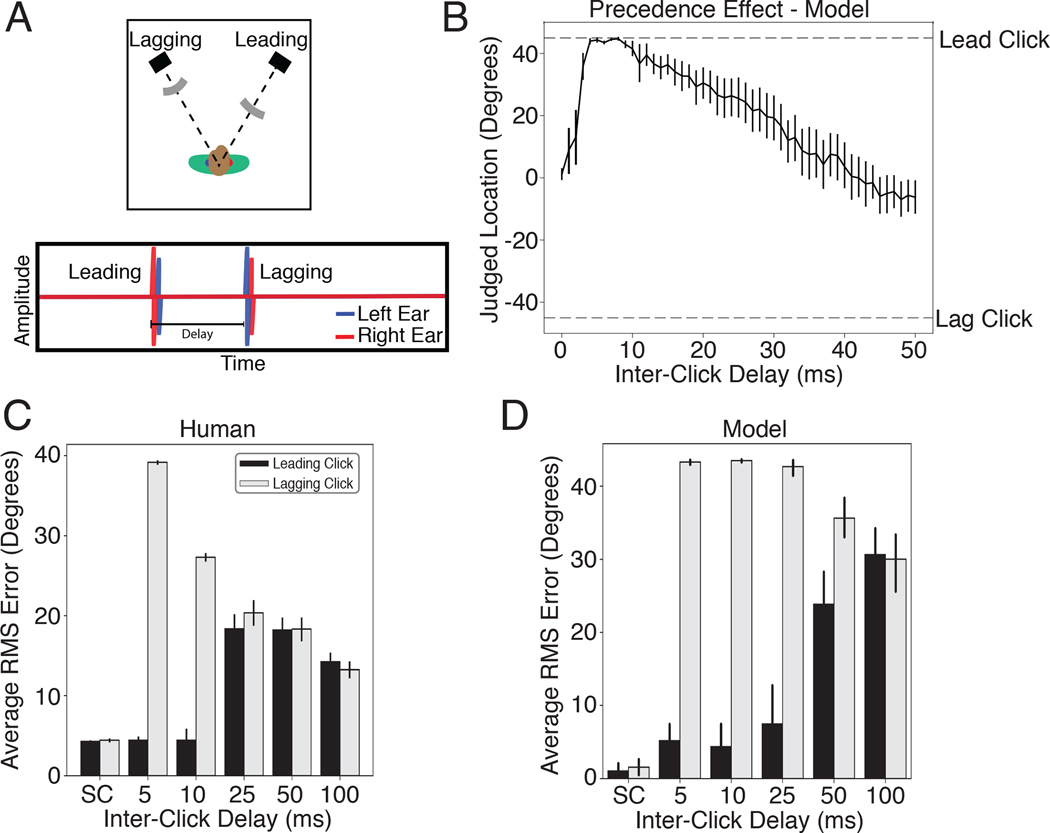
The precedence effect. A. Diagram of stimulus. Two clicks are played from two different locations relative to the listener. The time interval between the clicks is manipulated and the listener is asked to localize the sound(s) that they hear. When the delay is short but non-zero, listeners perceive a single click at the location of the first click. At longer delays listeners hear two distinct sounds. B. Localization judgments of the model for two clicks at +45 and −45 degrees. The model exhibits a bias for the leading click when the delay is short but non-zero. At longer delays the model judgments (which are constrained to report the location of a single sound, unlike humans), converge to the average of the two click locations. Error bars plots SEM across the 10 networks. C. Error in localization of the leading and lagging clicks by humans as a function of delay. SC denotes a single click at the leading or lagging location. Error bars plot SD. Data scanned from original publication95. D. Error in localization of the leading and lagging clicks by the model as a function of delay. Error bars plots SEM across the 10 networks.

